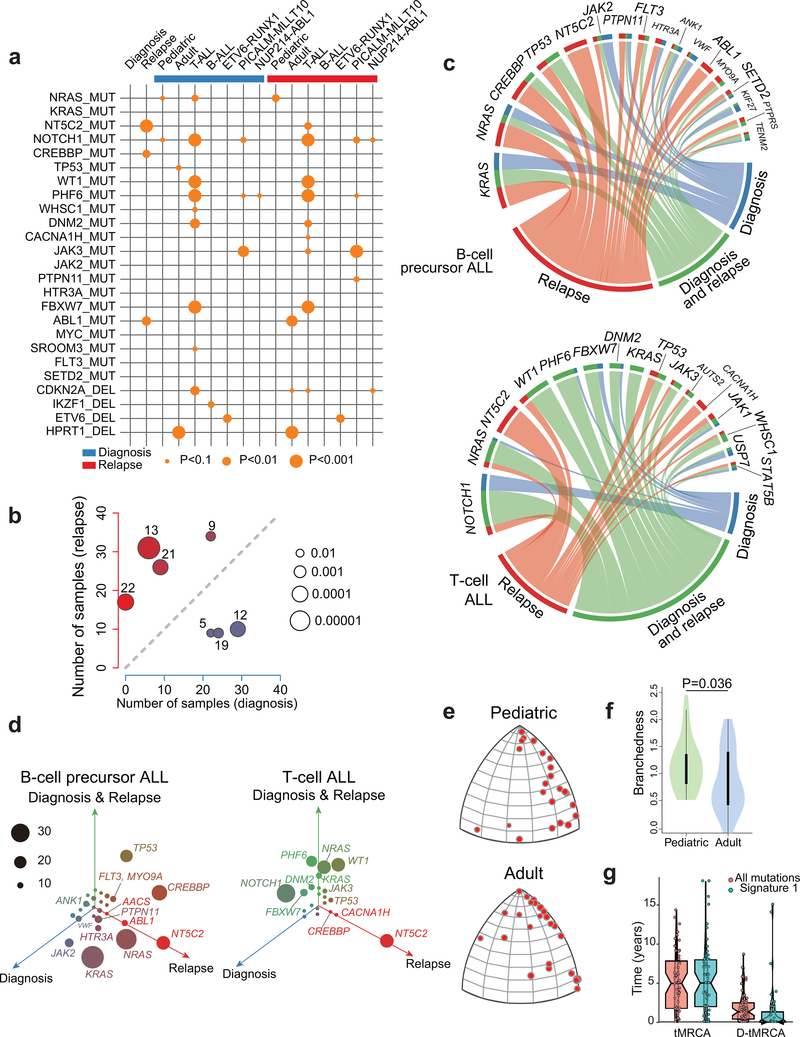
Figure 2 |. Mutational co-occurrence, signatures and clonal evolution of relapsed ALL.
a, Graphic representation of co-occurrence between pairs of patient age, genetic alterations and outcomes. Orange circles indicate co-occurrence and the size of each circle corresponds to the significance level of the correlation. b, Scatter plot representation of the number of samples with positive contribution across different mutation signatures in 46 diagnosis (blue; x-axis) versus relapse (red; y-axis) samples. c, Circos plot representation of the distribution of diagnosis-specific (blue), relapse-specific (red) and common diagnosis and relapse (green) mutations in selected recurrently mutated genes in B-cell precursor ALL and T-cell ALL. d, Three-dimensional bubble plot showing the frequency of diagnosis-only (blue; left axis), relapse-only (red; right axis), and common diagnosis and relapse (green; upper axis) somatic nonsynonymous mutations in B-cell precursor and T-cell ALL. e, CAT(0) projections of branched evolution in pediatric and adult patients. f, Violin plot indicating the branchedness of pediatric and adult patient trajectories. g, Left: distribution of the inferred age of Most Recent Common Ancestor (tMRCA) of the two dominant clones at diagnosis and relapse. Right: distribution of the number of years that the most recent common ancestor predated the diagnosis of the disease (D-tMRCA). Line of the notched boxplots represents the median. Lower and upper hinges represent the 25th and 75th percentiles respectively.

