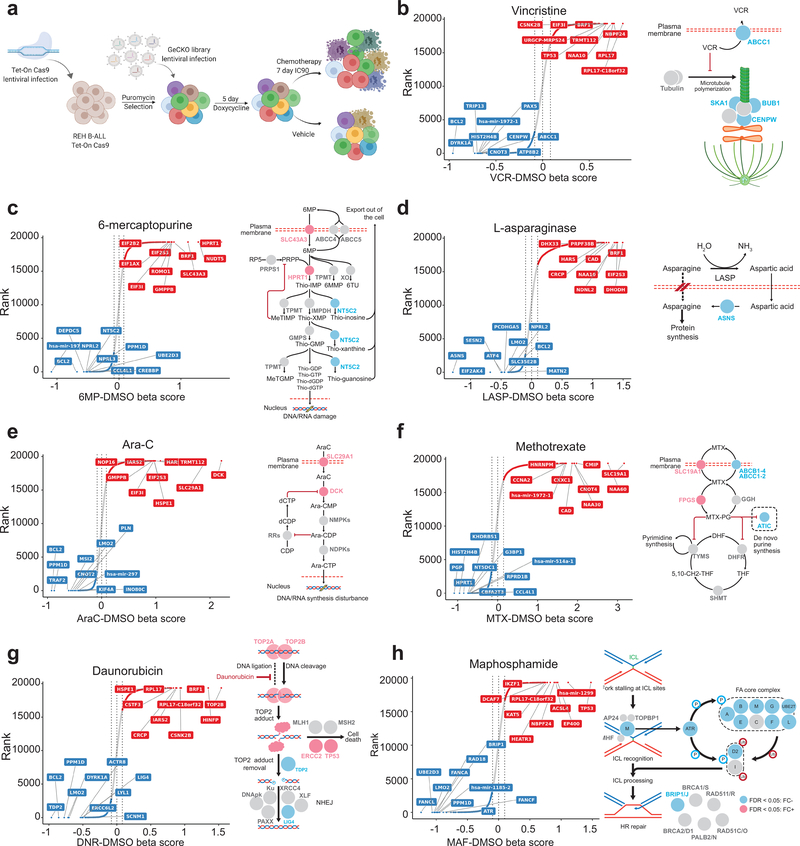
Figure 3 |. Genome wide CRISPR analysis of chemotherapy-gene interactions.
a, Schematic illustration of inducible Genome-Scale CRISPR/Cas9 knock-out screening in REH B-precursor ALL cells. b-h, CRISPR screen results and schematic representation for drug-gene interactions across seven chemotherapy drugs. Genes are ranked based on the enrichment of their respective gRNAs compared to vehicle-treated controls. Red and blue circles in b-h indicate genes with enriched and depleted gRNAs (FDR < 0.05), respectively.

