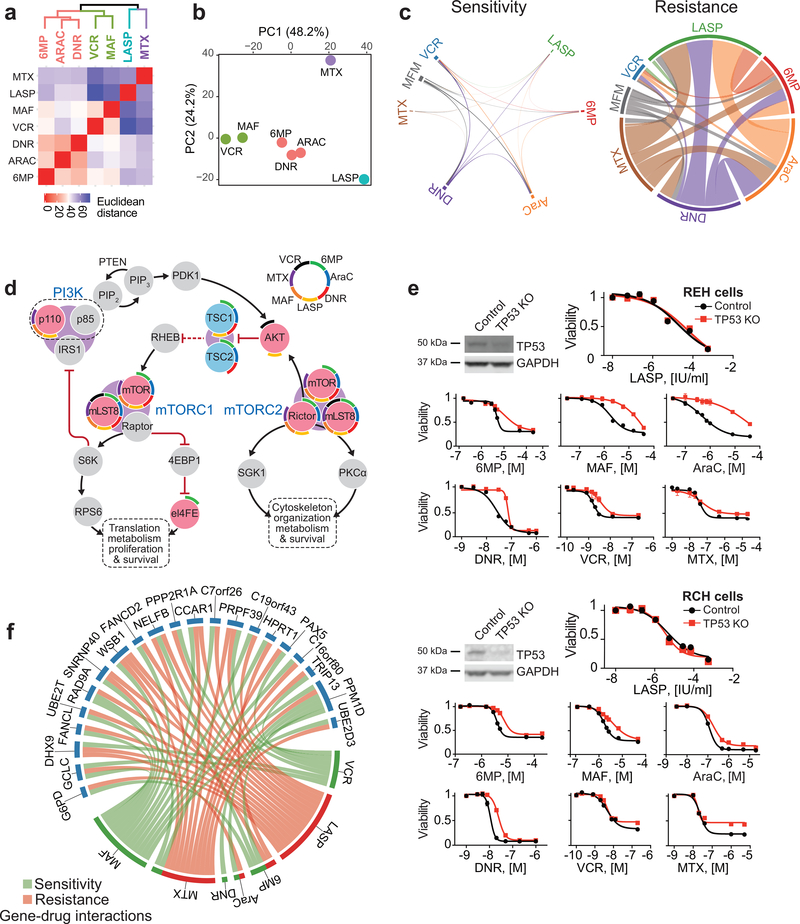
Figure 4 |. Convergent and divergent gene-chemotherapy drug interactions.
a, Hierarchical cluster analysis of gene-drug interactions from genome-wide CRISPR screens in REH cells treated with different chemotherapy drugs. b, Principal component analysis (PCA) of gene-drug interactions as in a. Each drug feature is plotted based on the top contributing genes to each of the first 2 principle components. Genes with enrichment (positive or negative) greater than 0.5 log fold-change and false discovery rate less than 5% were used in these analyses. c, Circos plot representation of overlapping genes with gRNAs enriched and depleted across different chemotherapy selection-based CRISPR screens. d, Schematic representation of PI3K-mTOR pathway drug-gene interactions identified in genome wide CRISPR screens. Red and blue circles in indicate genes with enriched and depleted gRNAs (FDR < 0.05), respectively. Drug interactions for each gene are in colored arch segments as indicated. e, Western blot analysis of TP53 inactivation and in vitro analyses of the antileukemic responses of REH and RCH control and CRISPR TP53 knockout cells treated with chemotherapy drugs. f, Circos plot representation of genes with divergent gRNA selection profiles across CRISPR screens with different chemotherapeutic drugs. Green links indicate sensitivity; red links indicate resistance. 6-MP: 6-mercaptopurine; AraC: cytarabine; MTX: methotrexate; LASP: L-asparaginase, DNR: daunorubicin; VCR: vincristine; MAF: maphosphamide; (S): drug-sensitizing; (R): drug resistance. Graphs indicate relative cell viability compared to vehicle treated controls.

