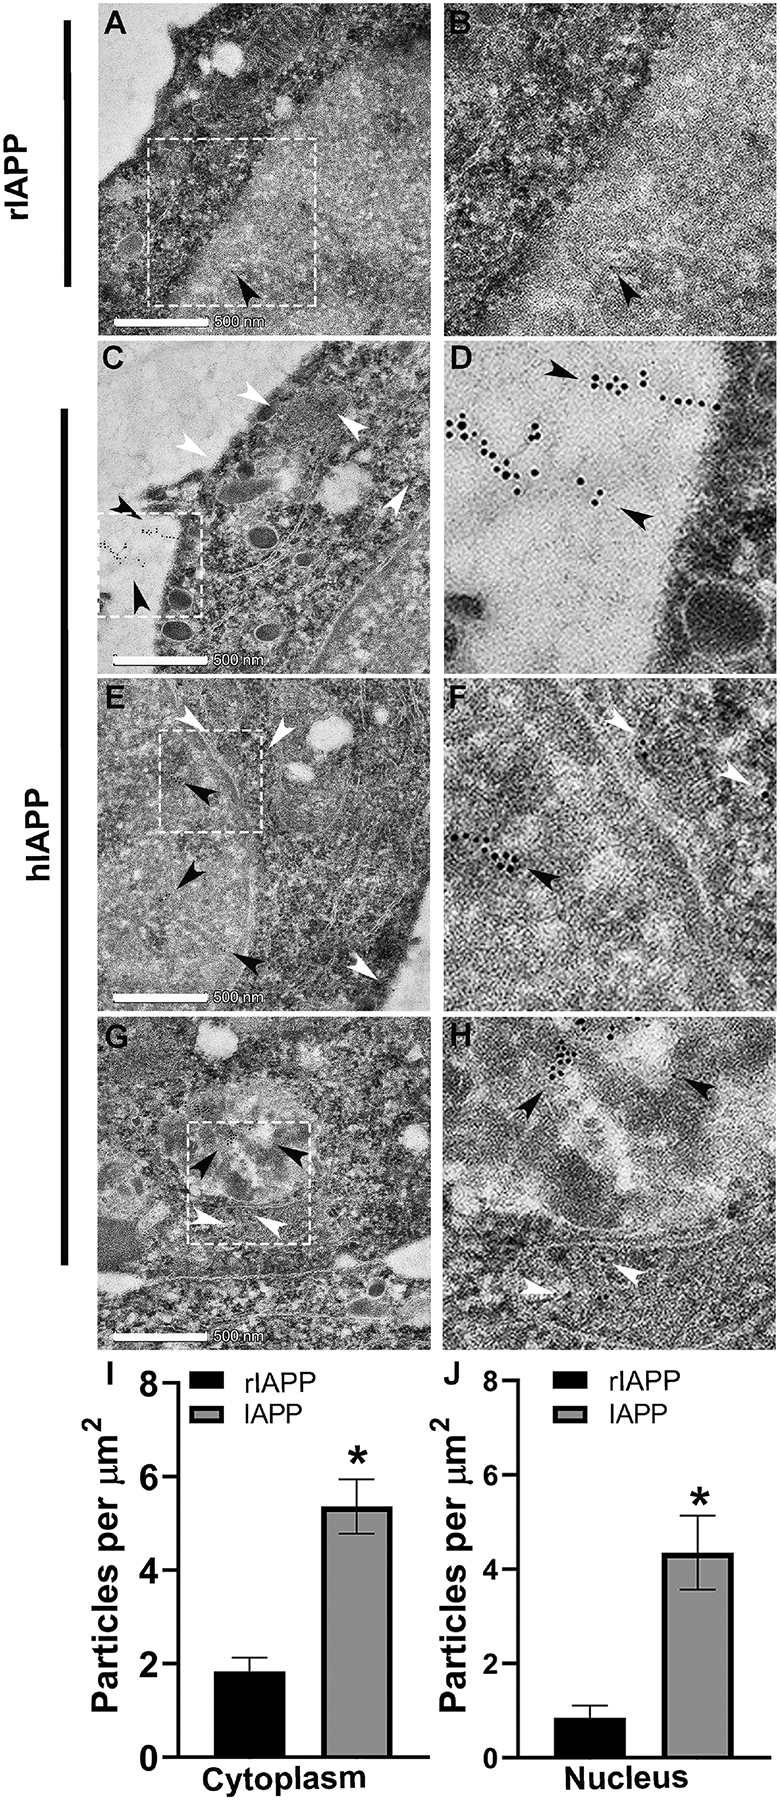
Figure 2. TEM analysis of IAPP trafficking in rat insulinoma cells.

Synchronized control (rIAPP) and hIAPP-expressing rat insulinoma (INS 832/13) cells were harvested and processed for TEM analysis as described in material and methods. (A-B) Control rat INS 832/13 cells were examined for rat IAPP intracellular distribution. Representative EM image depicts rat IAPP immuno-localization in the nucleus (arrowhead) of control cells. (C-D) EM analysis revealed secretion and extracellular accumulation of immuno-gold conjugated hIAPP antibodies in hIAPP-expressing cells (depicted by black arrowheads). (E-F) TEM shows nuclear (black arrowheads) and cytosolic (white arrowheads) accumulation of IAPP in hIAPP-expressing cells. (G-H) hIAPP was also found in the mitochondria (white arrowheads) and autophagosomes (black arrowheads). (I, J) Immuno-quantitative analysis of IAPP accumulation in the nucleus and cytosolic compartments of control (rIAPP-expressing, black) and stable hIAPP-expressing (gray) INS 832/13 cells. *p<0.05, Student’s t-test. Magnified areas in original images (white box) are presented on the right. Bar, 500 nm.
