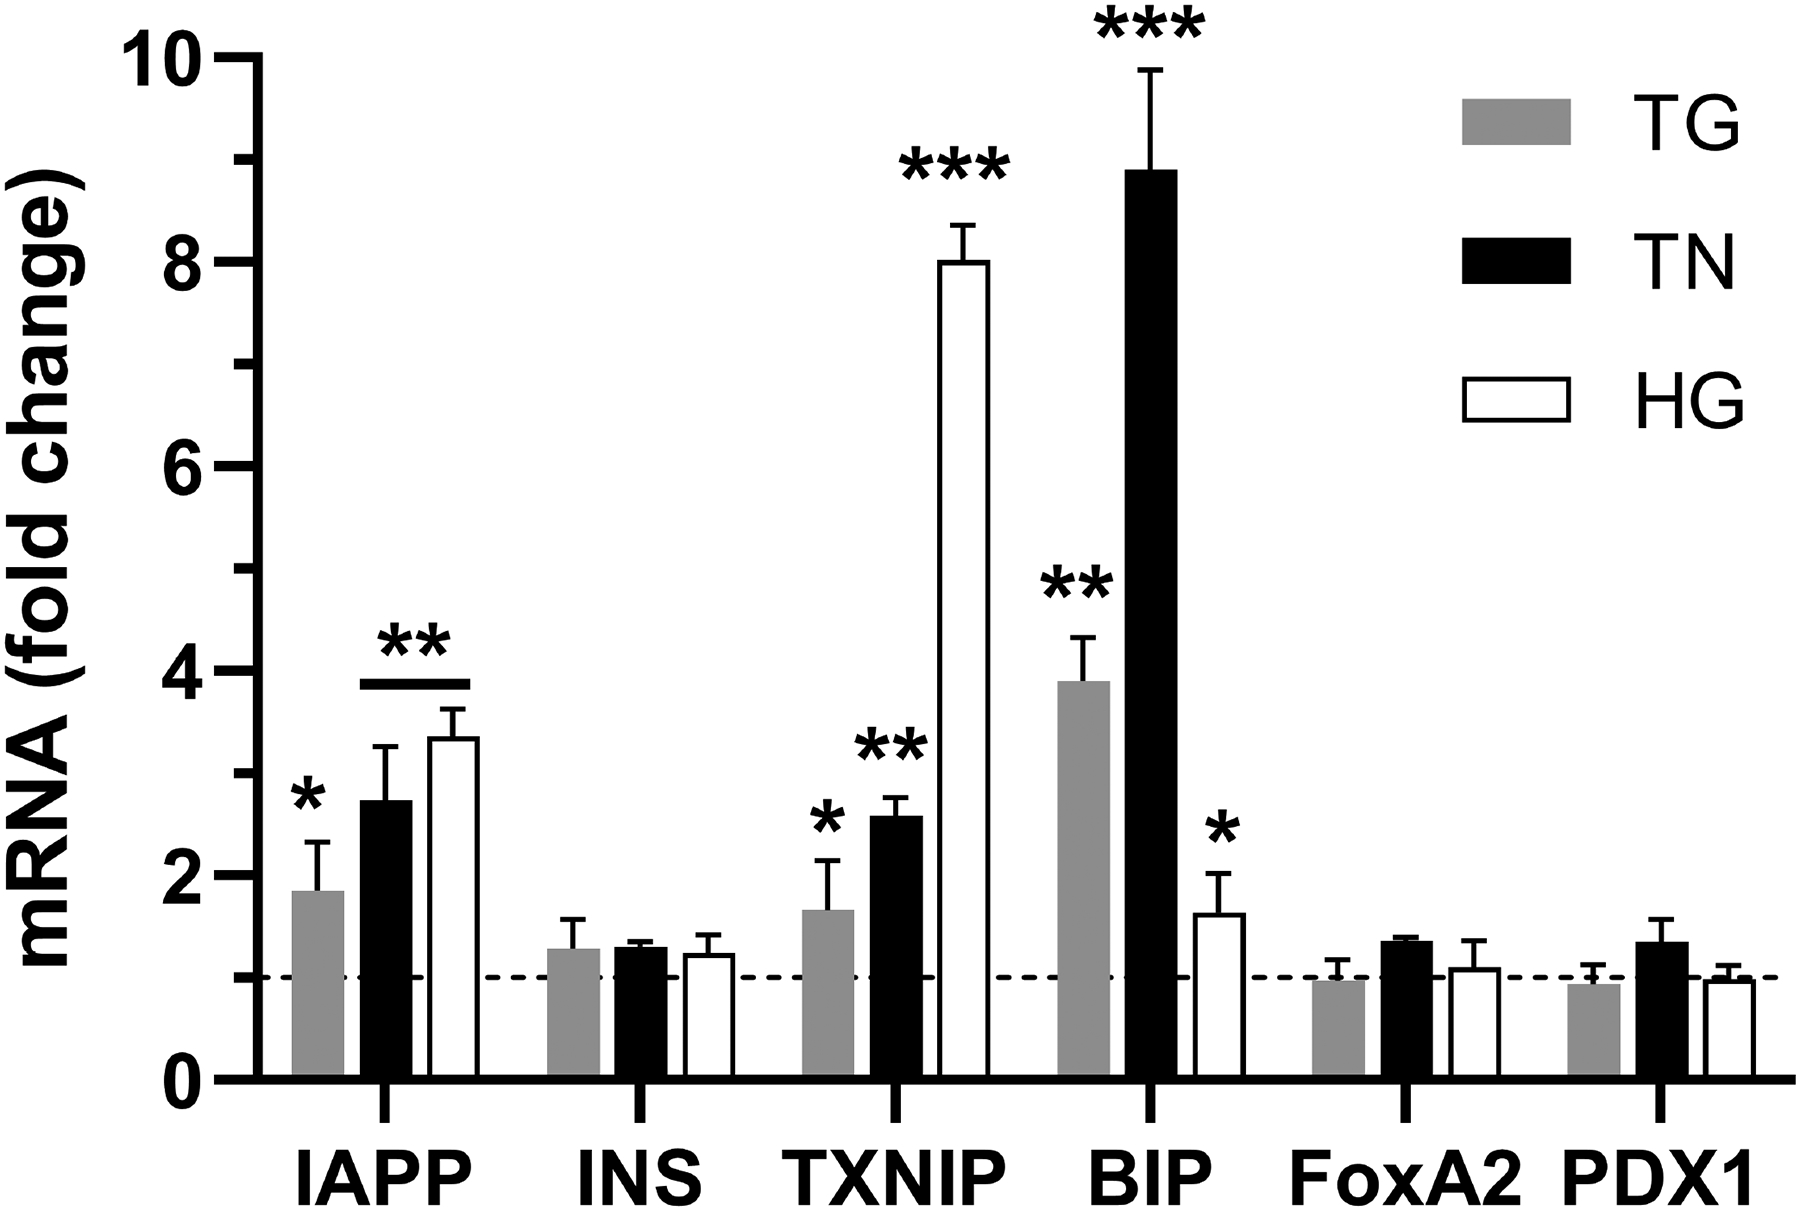
Figure 9. Transcriptomic analysis of normal and stressed cultured human islets.

Freshly isolated non-diabetic human islets were cultured in the presence of high (20mM) glucose (HG), 0.5 μM thapsigargin (TG), or 0.5 μM tunicamycin (TN) for 24h. Changes in mRNA levels of various genes analyzed by RT-qPCR. Cq values, reflecting mRNA levels, were normalized to a housekeeping gene (actin) and relative gene expression was calculated as described in the method section. Line denotes baseline gene expression in control islets. Significance was established at *p< 0.05, **p< 0.01, ***p< 0.001, ANOVA followed by Tukey’s post hoc comparison test. Data represent mean ± SEM of three independent experiments.
