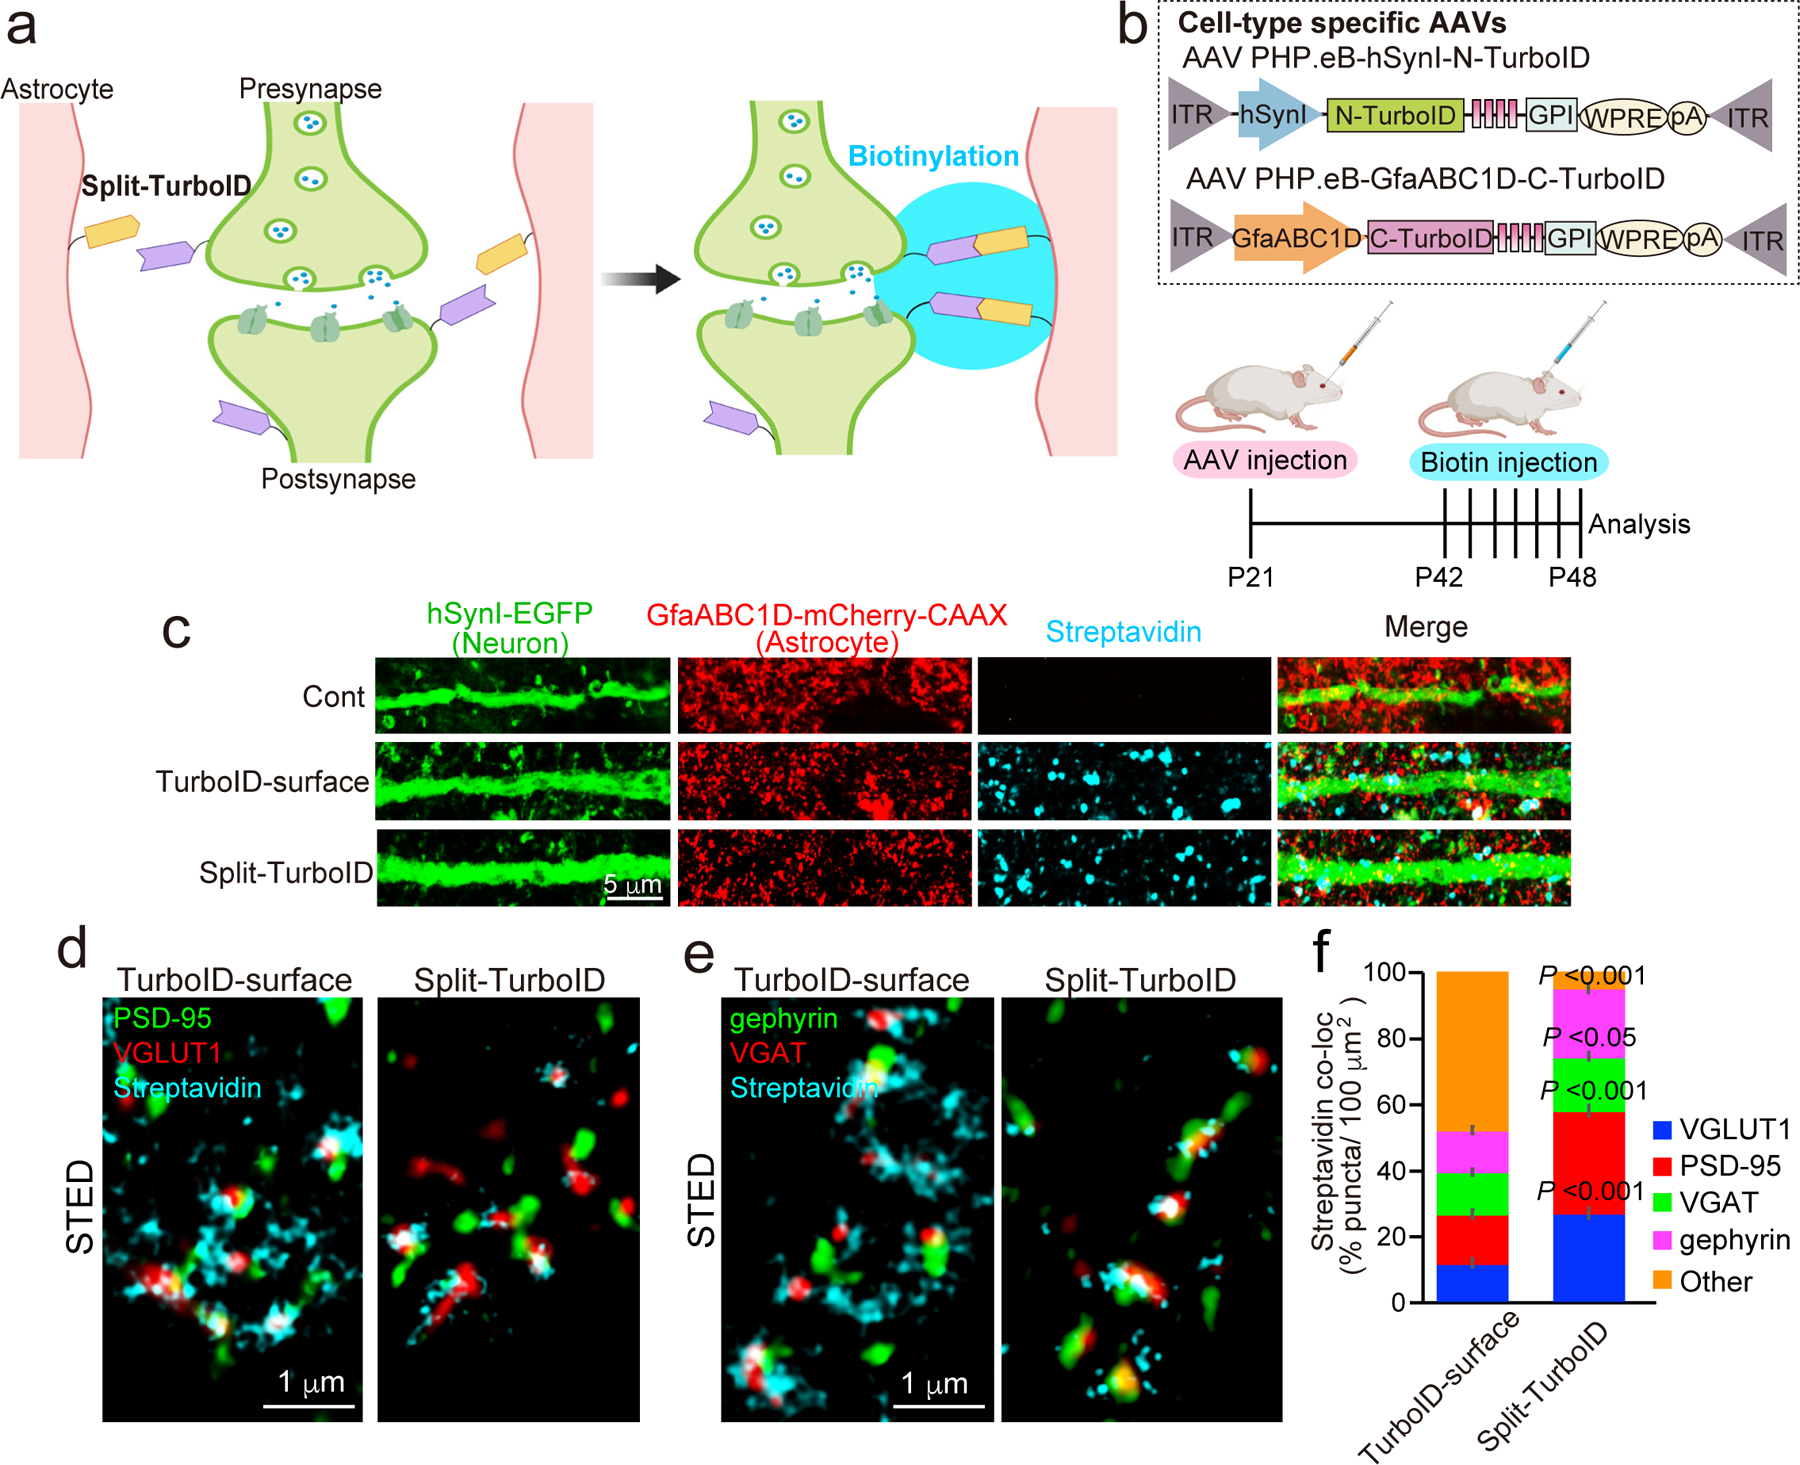
Figure 1. Astrocyte-neuron synaptic cleft proteome using in vivo Split-TurboID.

a, Schematic of the Split-surface iBioID approach. b, Outline of Split-TurboID method using cell-type specific AAVs. c, Confocal images of cortical expression of Split-TurboID or TurboID-surface co-expressed with neuronal-EGFP and astrocyte-mCherry-CAAX. d and e, Three-color STED images showing biotinylated proteins adjacent to d) excitatory synaptic markers PSD-95 and VGLUT1, and e) inhibitory synaptic markers gephyrin and VGAT. f, The ratio of biotinylated proteins that was co-localized with VGLUT1, PSD-95, VGAT or gephyrin. n= 15 cells per each condition from 3 mice. n= 3 biological repeats. Student’s t-test (paired, p<0.001, 0.05). Data represent means ± s.e.m.
