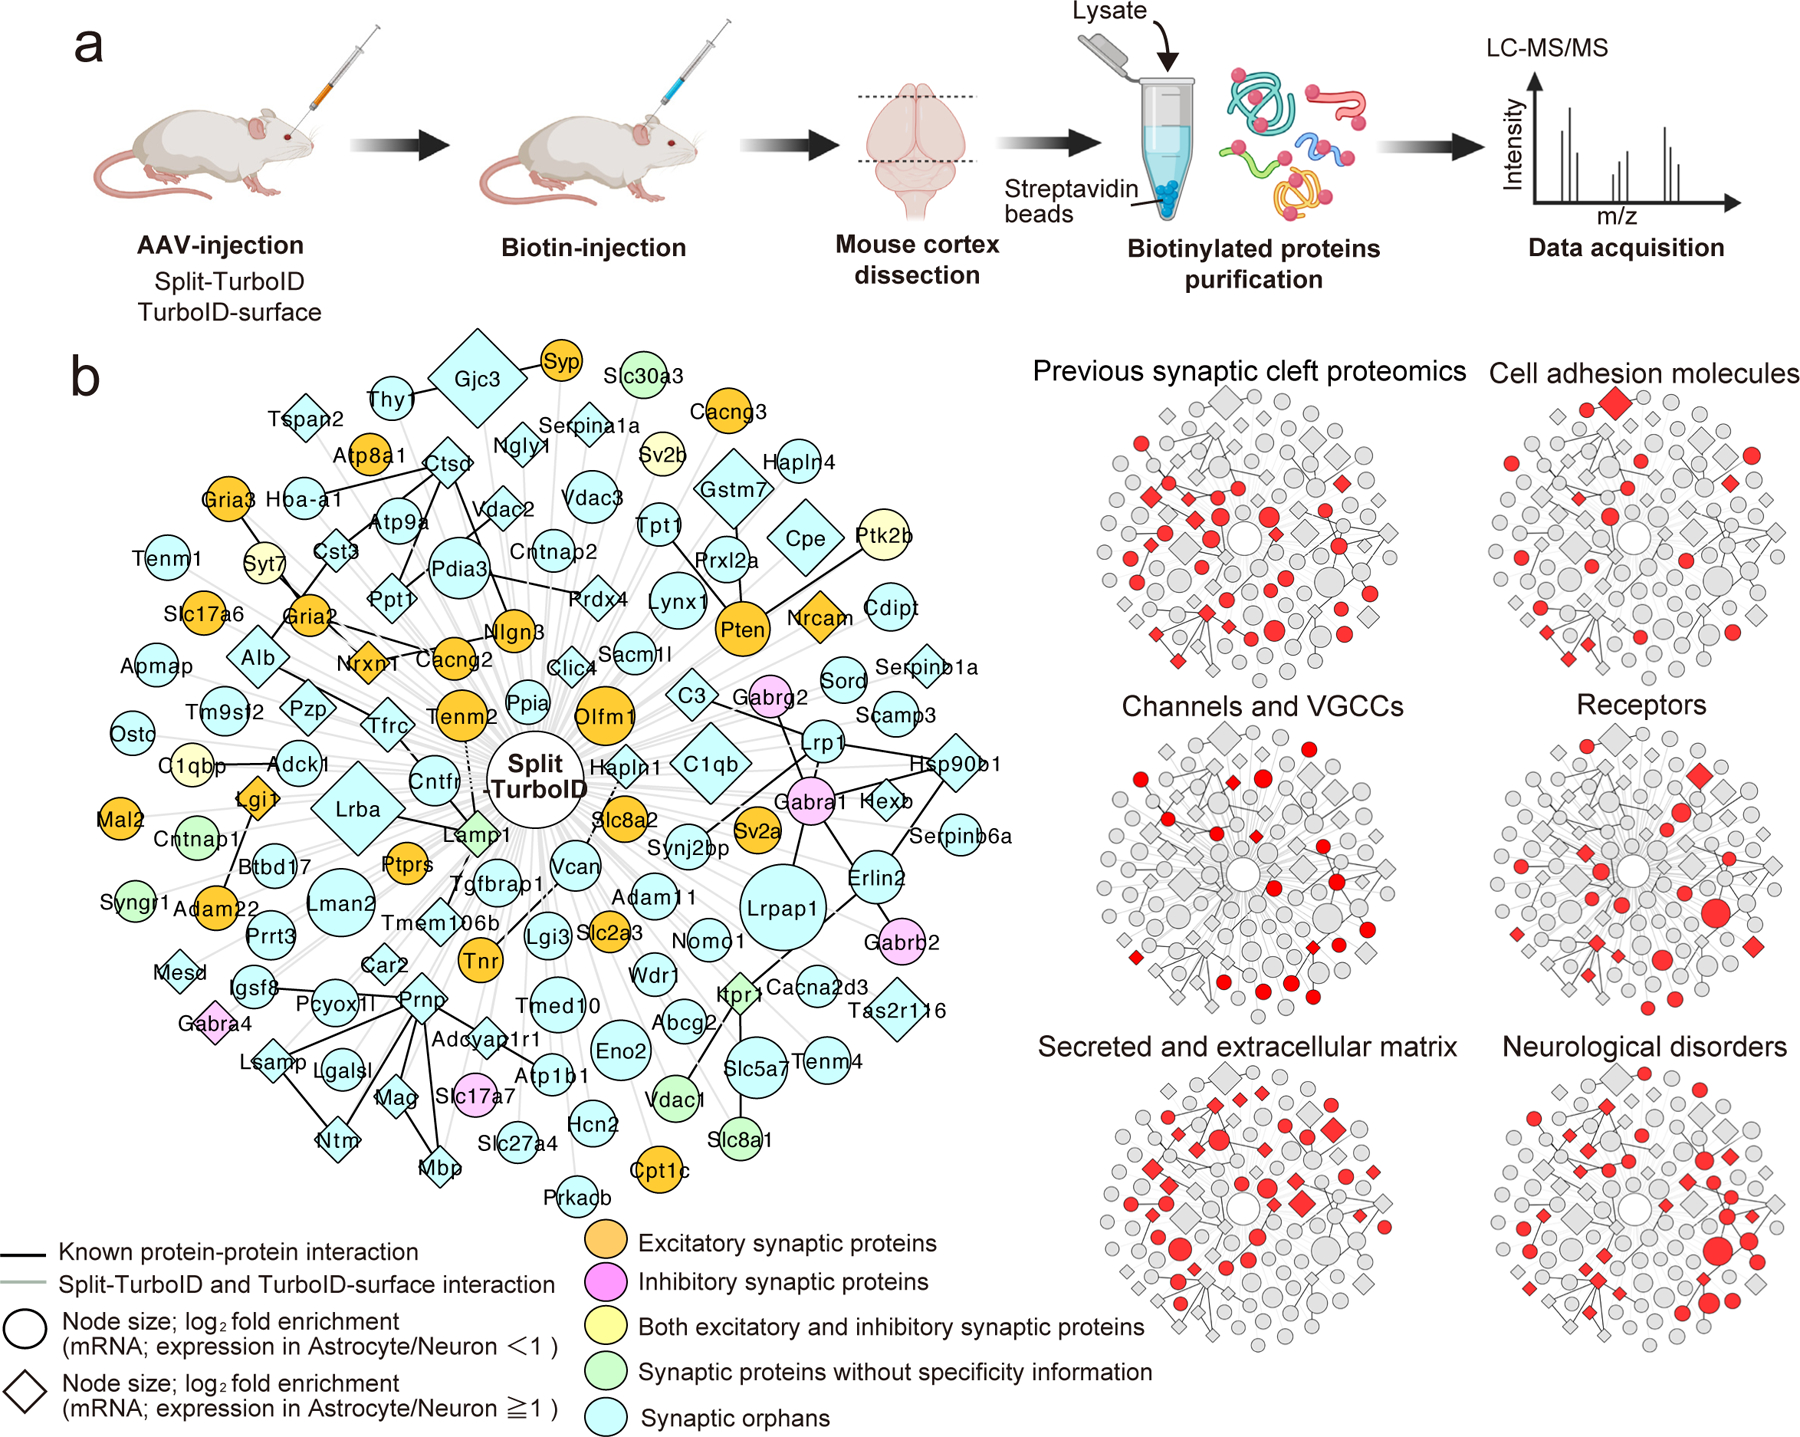
Figure 2. Astrocyte-neuron synaptic cleft proteome.

a, Outline of proteomic approach. b, Left, Overlapping high-confidence proteins shared between the Split-TurboID and TurboID-surface enriched fractions. Right, Clustergram topology of proteins in selected functional categories. Note: node titles are gene name; size represents fold-enrichment over negative control. Neuronal enriched proteins (RNAseq expression ratio<1) and astrocyte enriched proteins (RNAseq expression ratio≧1.0) are represented as circle or diamond, respectively. Edges are shaded according to types of interactions (gray, iBioIDs; black, protein-protein interactions previously reported).
