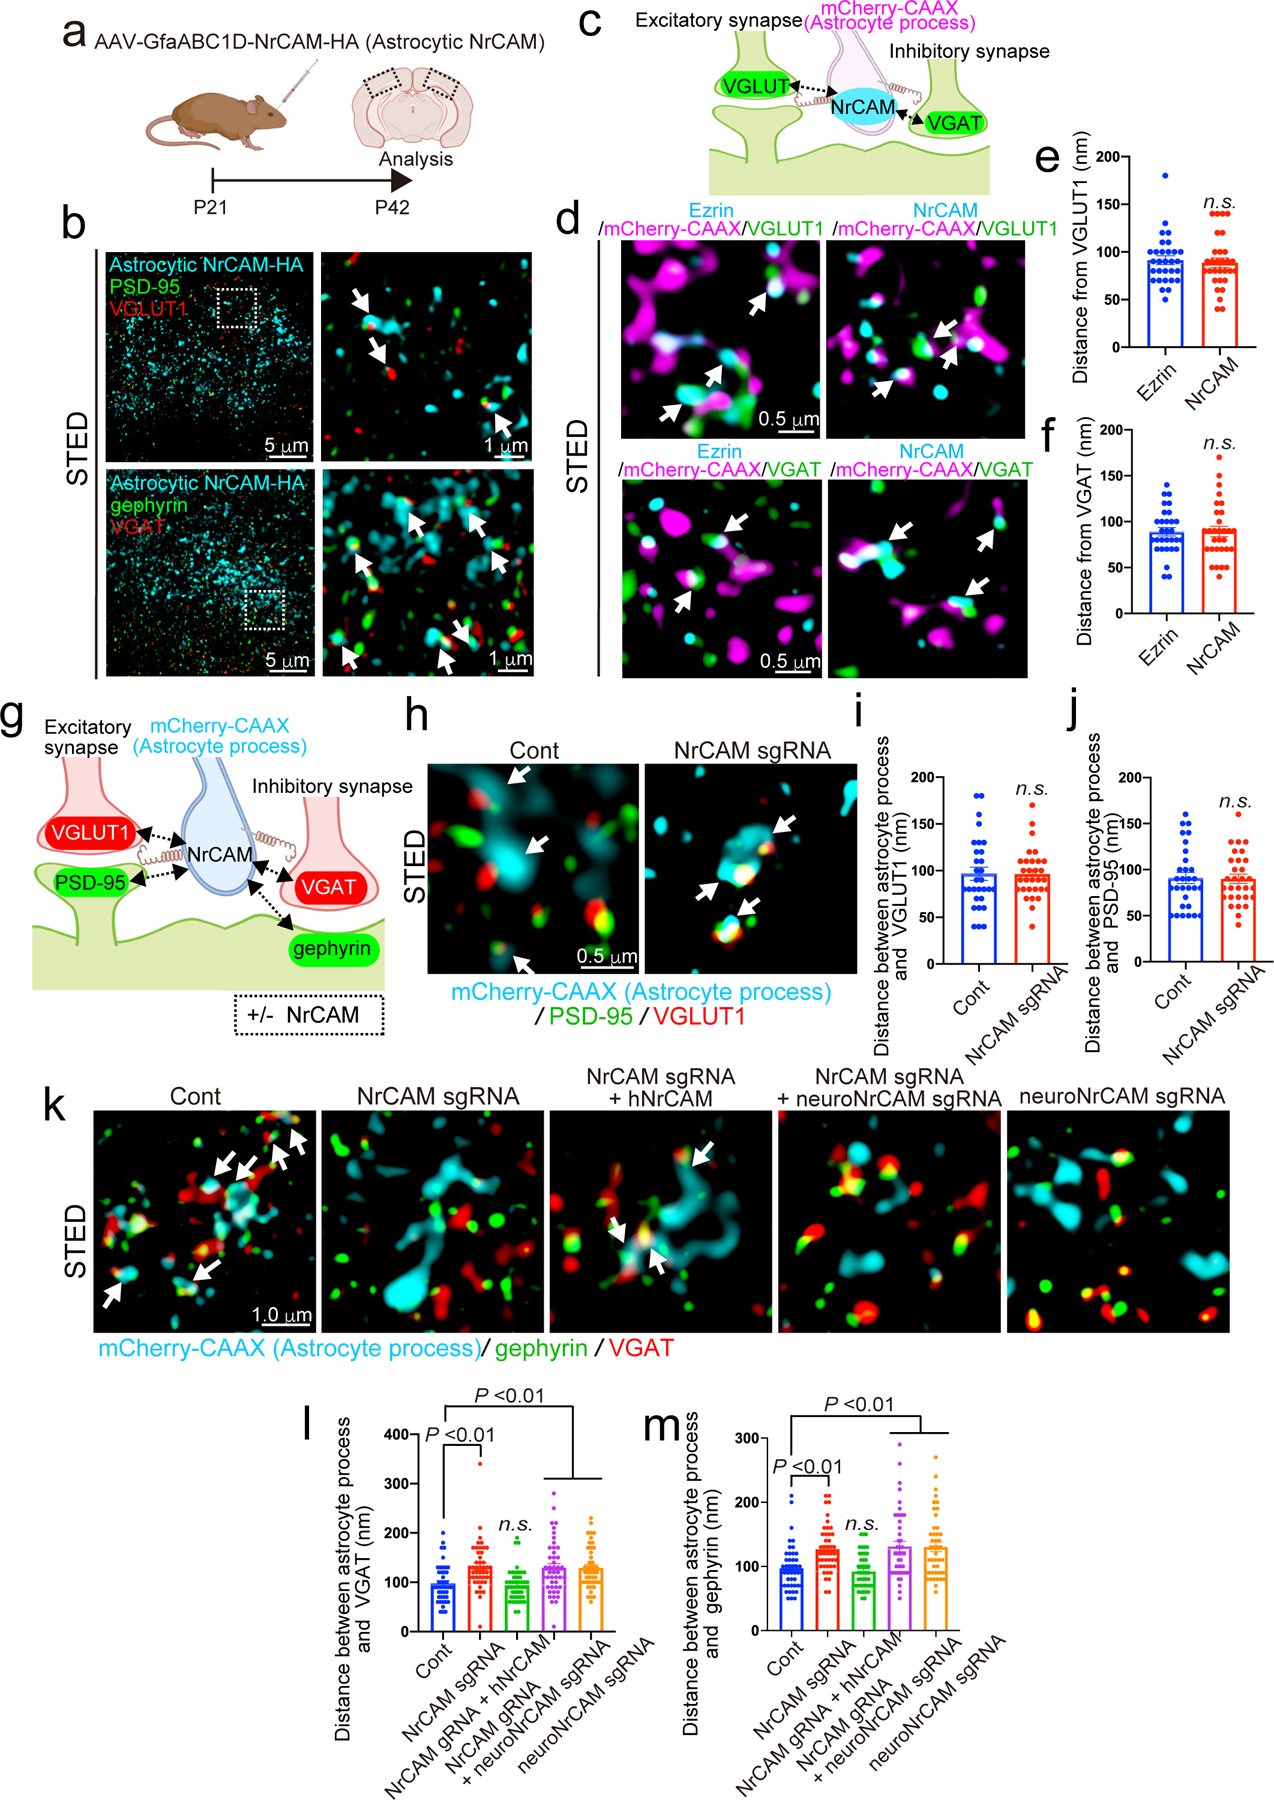
Figure 3. NrCAM controls astrocyte-neuron contacts in vivo.

a, Schematic of the visualization of astrocytic NrCAM in vivo. b, Three-color STED images demonstrating that astrocytic NrCAM are adjacent to excitatory synapses or inhibitory synapses. c, Schematic of astrocytic NrCAM distribution assay in vivo. d, Three-color STED images showing mCherry-CAAX-positive NrCAM or Ezrin adjacent to excitatory presynapses and inhibitory presynapses. e and f) Quantification of average distance between astrocytic NrCAM and VGLUT1 or VGAT (n= 30 puncta per each condition from 3 brains). g, Schematic of astrocytic process and neuronal synapses contact assay in vivo. h-m, Three-color STED images of astrocytic process following deletion of astrocyte NrCAM adjacent to excitatory synapses (h) or inhibitory synapses (k). i-j and l-m, Quantification of average distance between astrocytic process and excitatory synapses (i-j) or inhibitory synapses (l-m) (n= 30 puncta per each condition from 3 brains). n= 3 biological repeats. Student’s t-test (paired, p<0.001) (e, f, i, j). One-way ANOVA (Dunnett’s multiple comparison, p<0.01) (l, m). Data represent means ± s.e.m.
