. 2021 Mar 31;129(3):037010. doi: 10.1289/EHP8222

Figure 2.

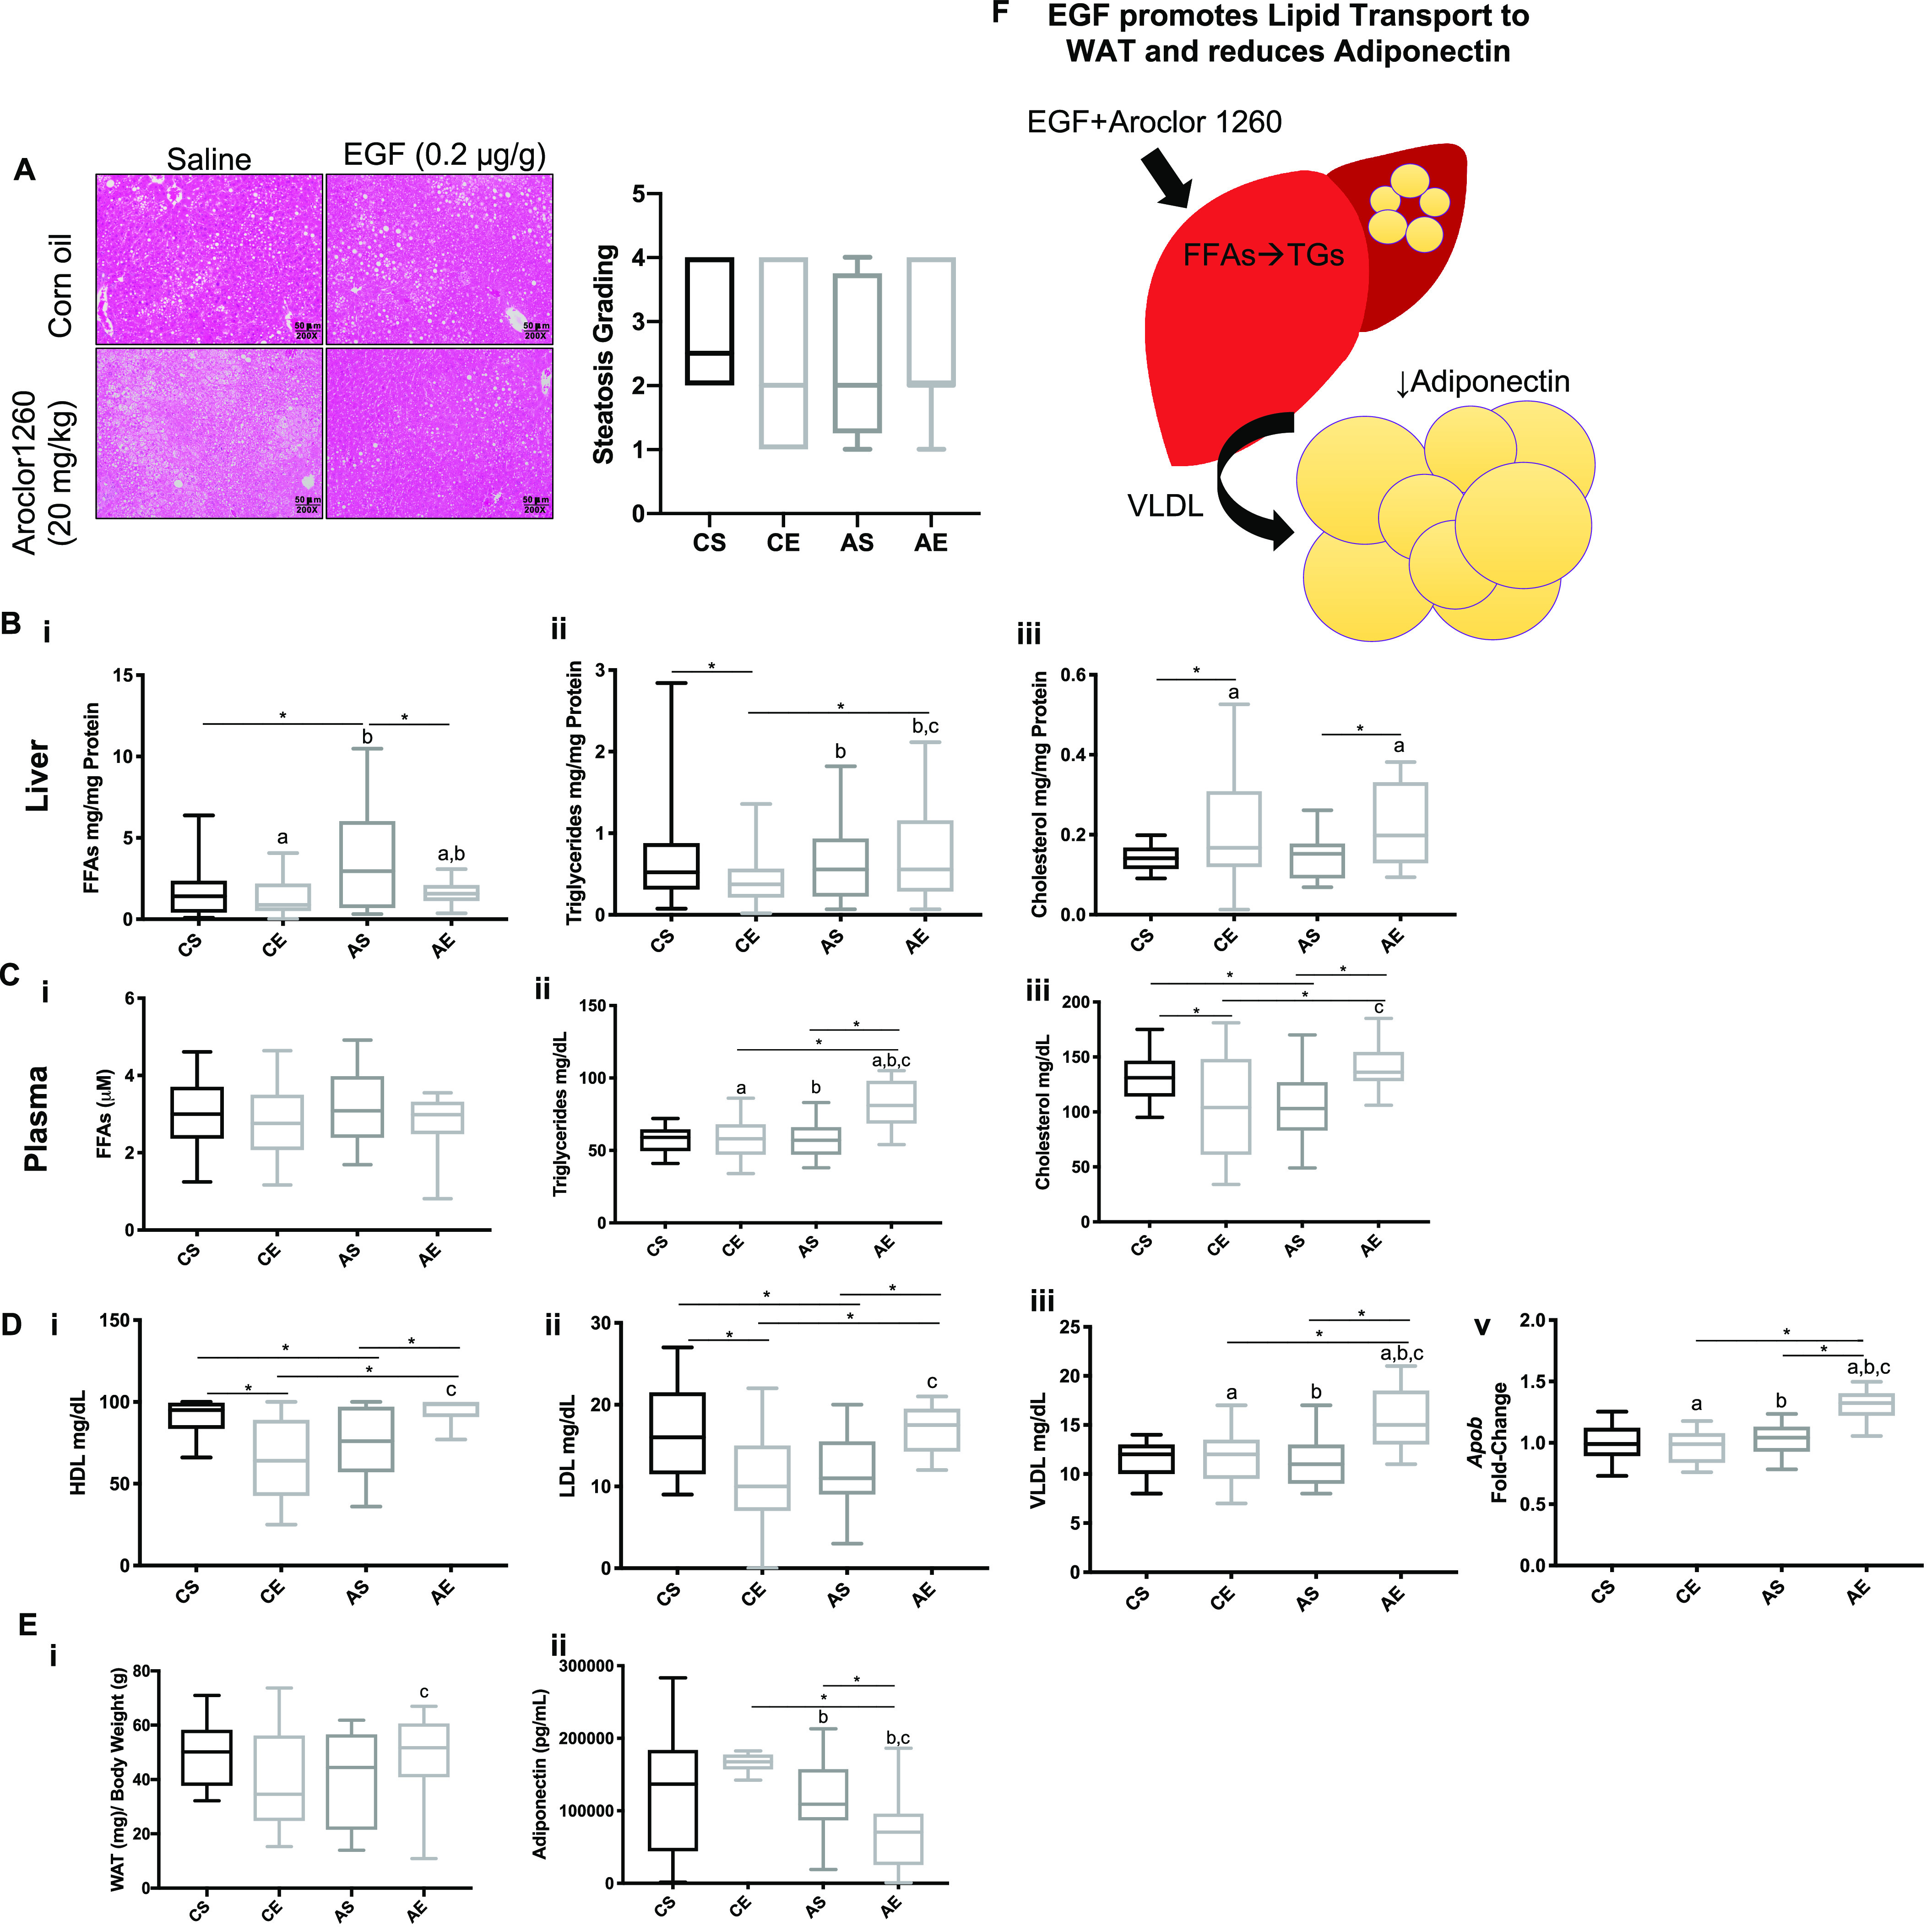
Figure 2A is a set of one stained issue and one box plot graph. A representative image of Hematoxylin and Eosin staining of liver sections in mice with 50 micrometers captured by 200 X objective lens plotting saline and epidermal growth factor (0.2 microgram per gram) columns across corn oil and aroclor 1260 (20 milligrams per kilogram) rows. A box plot graph plotting Steatosis Grading, ranging from 0 to 5 in unit increments (y-axis) across control plus saline, control plus epidermal growth factor, aroclor 1260 plus saline, and aroclor 1260 plus epidermal growth factor (x-axis). Figure 2B1 to 2B3 titled liver are box plot graphs plotting Free fatty acids milligram per milligram Protein, ranging from 0 to 15 in increments of 5; Triglycerides milligram per milligram Protein, ranging from 0 to 3 in unit increments; Cholesterol milligram per milligram Protein, ranging from 0.0 to 0.6 in increments of 0.2 (y-axis) across control plus saline, control plus epidermal growth factor, aroclor 1260 plus saline, and aroclor 1260 plus epidermal growth factor (x-axis), respectively. Figures 2C1 to 2B3 titled Plasma are box plot graphs plotting Free fatty acids (micromolar), ranging from 0 to 6 in increments of 2; Triglycerides milligram per deciliter, ranging from 0 to 150 in increments of 50; and Cholesterol milligram per deciliter, ranging from 0 to 200 in increments of 50 (y-axis) across control plus saline, control plus epidermal growth factor, aroclor 1260 plus saline, and aroclor 1260 plus epidermal growth factor (x-axis), respectively. Figures 2D1 to 2B3 are boxplot graphs plotting high-density lipoprotein milligram per deciliter, ranging from 0 to 150 in increments of 50; low-density lipoprotein, ranging from 0 to 30 in increments of 10; Very low-density lipoprotein milligram per deciliter, ranging from 0 to 25 in increments of 5; and Apolipoprotein B fold change, ranging from 0.0 to 2.0 in increments of 0.5 (y-axis) across control plus saline, control plus epidermal growth factor, aroclor 1260 plus saline, and aroclor 1260 plus epidermal growth factor (x-axis), respectively. Figures 2E1 and E2 are box plot graphs plotting White adipose tissue (milligram per gram or body weight (gram), ranging from 0 to 80 in increments of 20 and Adiponectin (picogram per milliliter), ranging from 0 to 300000 in increments of 100000 (y-axis) across control plus saline, control plus epidermal growth factor, aroclor 1260 plus saline, and aroclor 1260 plus epidermal growth factor (x-axis), respectively. Figure 2F is a schematic diagram in which the liver is exposed to Epidermal growth factor plus aroclor 1260, which elevated Free fatty acids to hepatic triglycerides and plasma very low-density lipoprotein in Adiponectin.

The effects of Aroclor 1260 exposure and EGF treatment on lipids in liver, blood, and adipose tissue in mice fed HFD. Male WT C57Bl/6 mice were fed an HFD (12 wk) and exposed to either vehicle or Aroclor 1260 (20mg/kg) by a one-time oral gavage at week 1. Aroclor 1260-exposed or vehicle mice were treated (via IP injection) with saline or EGF (0.2μg/g) daily for 10 d starting at week 10. Mice were fasted for 12 h and euthanized, and tissues were harvested for downstream analyses. (A) Representative image of H&E staining of liver sections in mice exposed to corn oil and injected with either saline (CS) or EGF (0.2μg/g) (CE) or gavaged with Aroclor 1260 (20mg/kg) and injected with saline (AS) or EGF (AE). One liver section per mouse was evaluated (n=17 per experimental group). Also included is the quantification from the steatosis grading. Steatosis grading was as follows: 1=normal (<5%), 2=mild (5%–33%), 3=moderate (34%–66%), and 4=severe (>66%). (B) Hepatic measures of (Bi) FFAs, (Bii) TGs, and (Biii) cholesterol. (C) Plasma measures of (Ci) FFAs, (Cii) TGs, and (Ciii) cholesterol. (D) Plasma measures of (Di) HDL, (Dii) LDL, and (Diii) VLDL. (Dv) qPCR analysis of hepatic ApoB gene expression in CS, CE, AS, and AE mice. (E) Weight of epididymal WAT normalized to total body weight (Ei). Plasma measures of adiponectin (Ei) in CS, CE, AS, and AE mice. (F) Illustration demonstrating Aroclor 1260-exposed mice treated with EGF have elevated hepatic TGs and plasma VLDL. An n=17 was used for Figures 2A-E. A two-way ANOVA was used to statistically compare data sets followed a Sidak correction for intergroup comparisons. A p<0.05 was considered significant. Significance due to EGF is denoted by (a); due to Aroclor 1260 denoted by (b); and due to interaction denoted by (c) for the two-way ANOVA. A p<0.05 was denoted by * for the Sidak multiple comparison test. Data are presented as box and whisker plots for Figure 2 that illustrate the median (midline), upper and lower quartiles (box), and the upper and lower limits (whiskers). All numerical data are presented in Table S6 “Numerical Data” as mean±SD and p-values can be found in Table S5. Numeric outliers were identified by ROUT method and removed. The number of outliers are reported in Table S4. Note: AE, Aroclor 1260+EGF; ANOVA, analysis of variance; AS, Aroclor 1260+saline; CE, control+EGF; CS, control+saline; EGF, epidermal growth factor; FFAs, free fatty acids; HDL, high-density lipoprotein; H&E, hematoxylin & eosin; HFD, high-fat diet; IP, intraperitoneal; LDL, low-density lipoprotein; TGs, triglycerides; VLDL, very low-density lipoprotein; WAT, white adipose tissue.