. 2021 Mar 31;129(3):037010. doi: 10.1289/EHP8222

Figure 4.

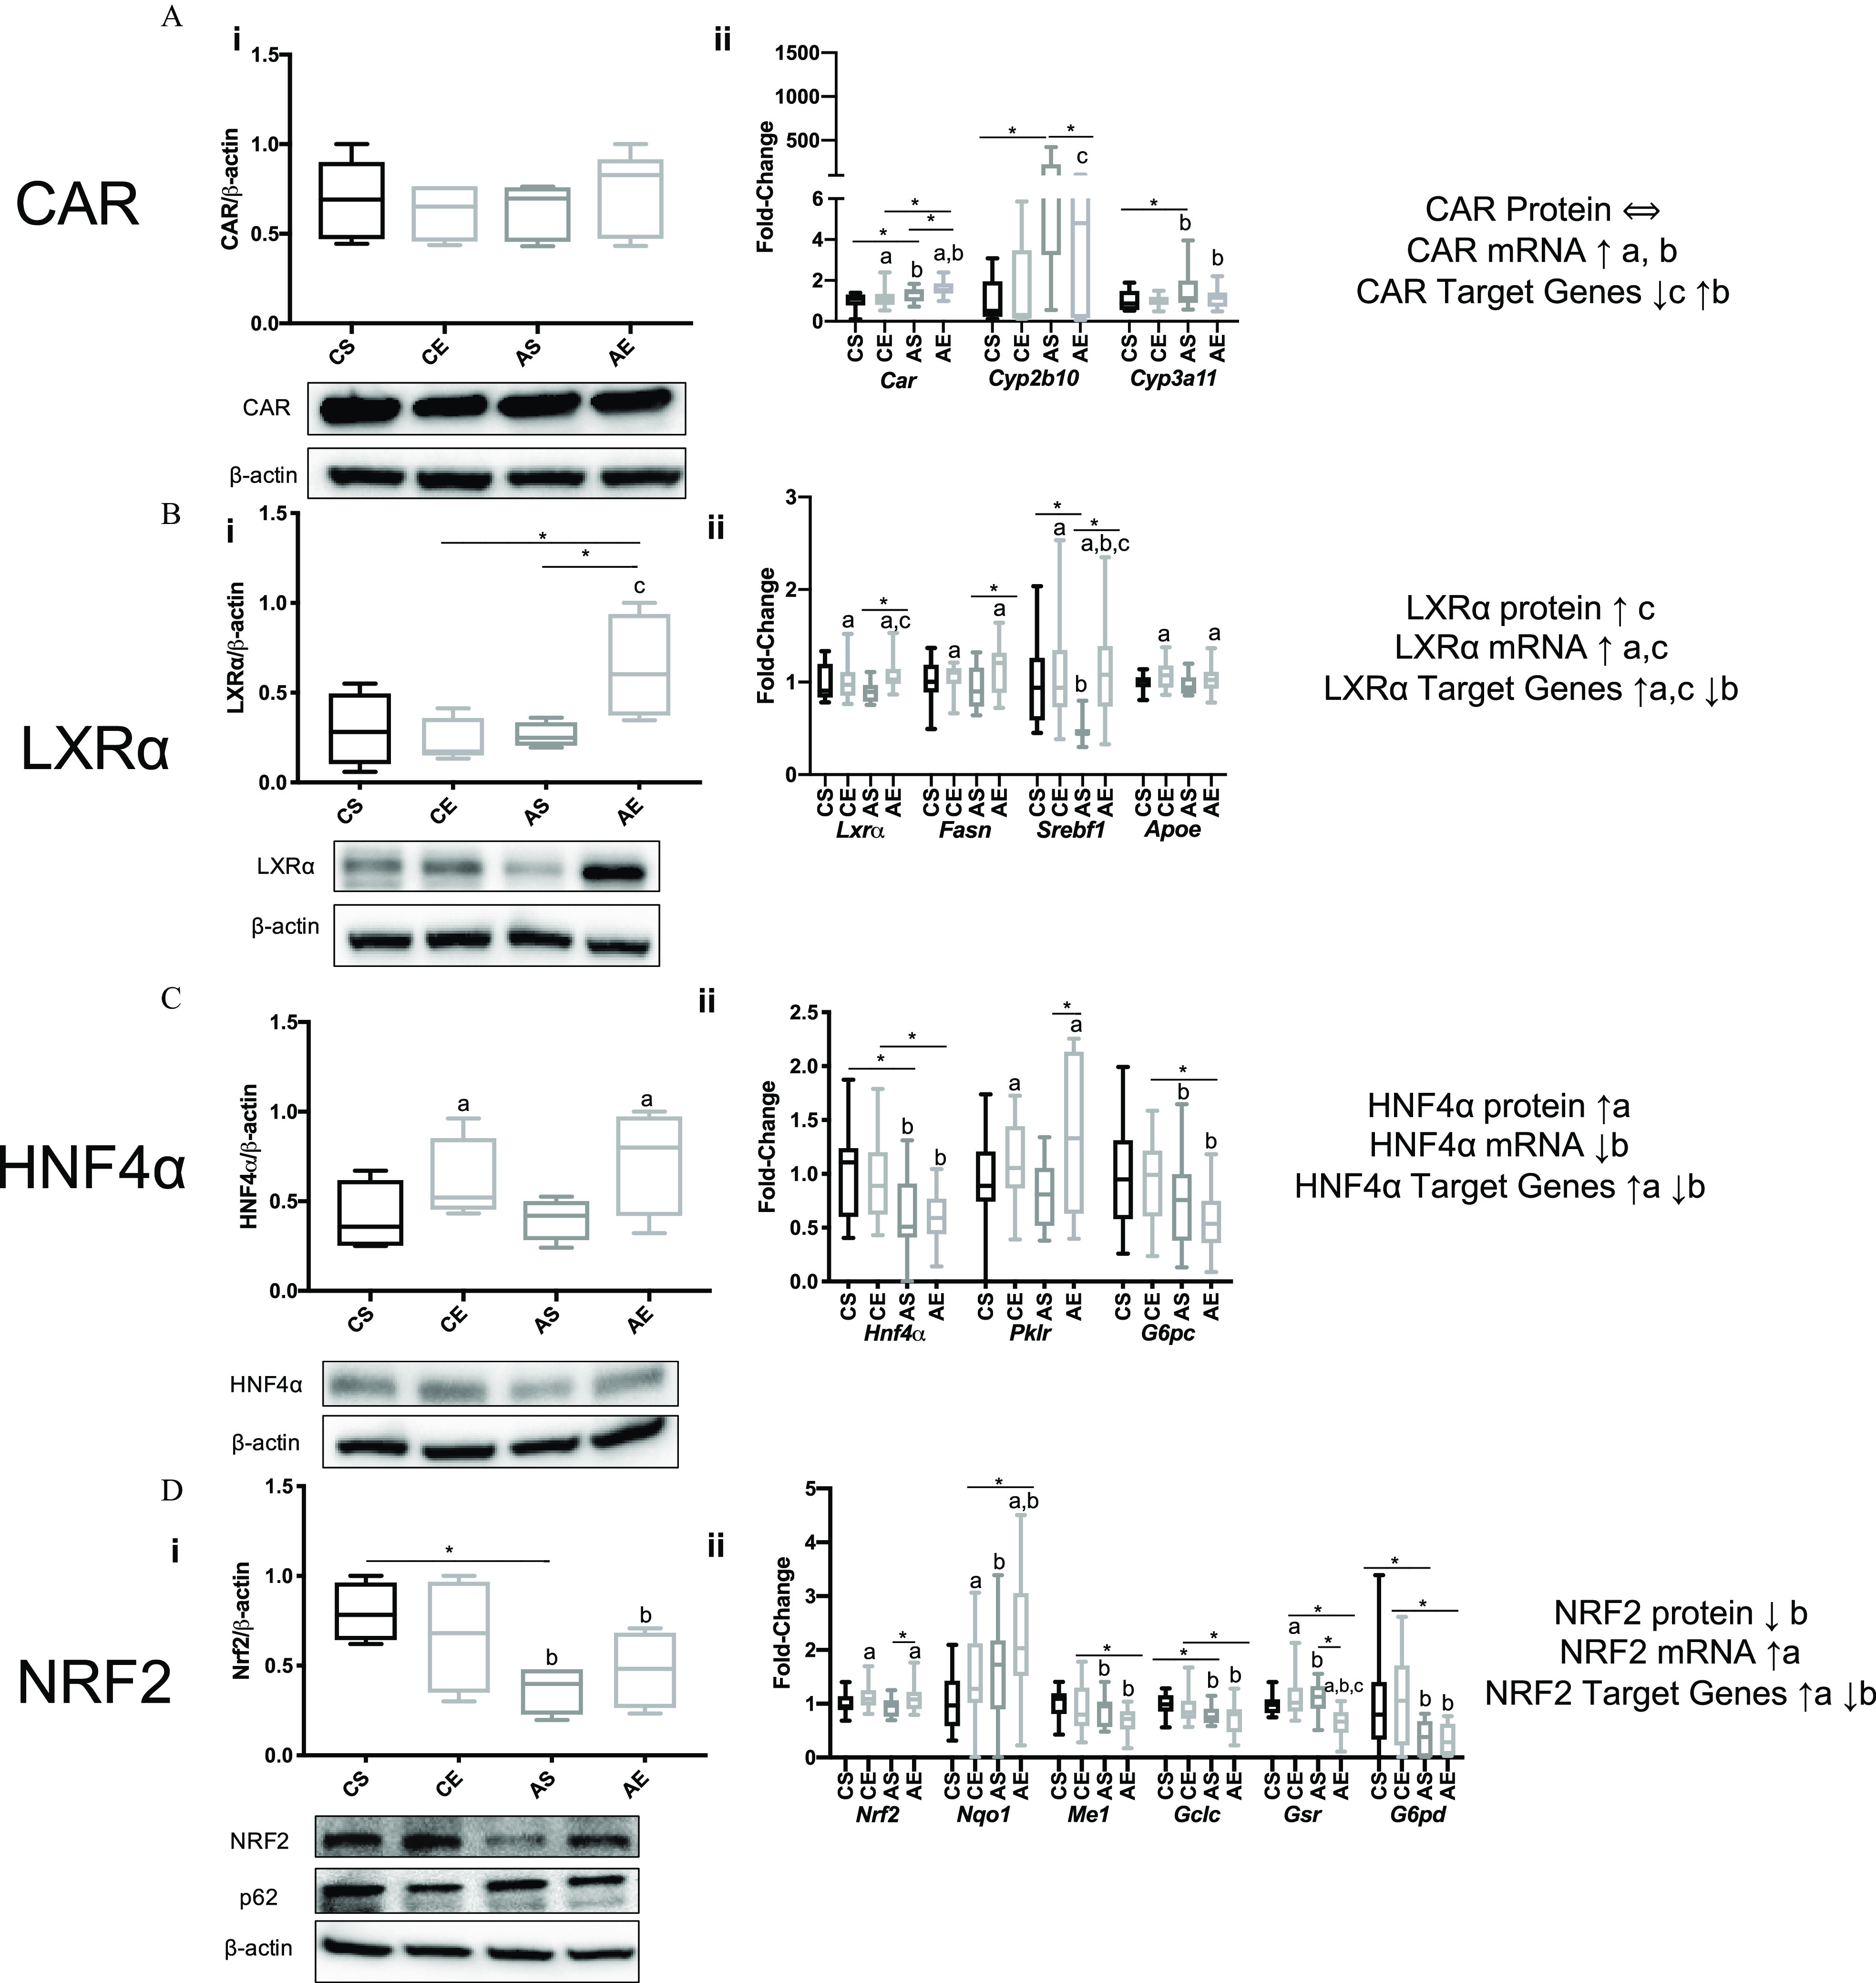
Figure 4A1 is a set of one boxplot graph and one western blot. The box plot titled Constitutive androstane receptor plotting Constitutive androstane receptor per lowercase beta actin, ranging from 0.0 to 1.5 in increments of 0.5 (y-axis) across control plus saline, control plus epidermal growth factor, aroclor 1260 plus saline, and aroclor 1260 plus epidermal growth factor (x-axis). The western blot plotting control plus saline, control plus epidermal growth factor, aroclor 1260 plus saline, and aroclor 1260 plus epidermal growth factor (columns) across Constitutive androstane receptor and lowercase beta actin (rows). Figure 4A2 is a clustered box plot graph titled Constitutive androstane receptor plotting fold change, ranging from 0 to 6 in increments of 2 and 500 to 1500 in increments of 500 (y-axis) across Constitutive androstane receptor, Cytochrome P450 2B10, and Cytochrome P450 3A11 each includes, control plus saline, control plus epidermal growth factor, aroclor 1260 plus saline, and aroclor 1260 plus epidermal growth factor (x-axis) for Constitutive androstane receptor protein equivalent to, Constitutive androstane receptor Messenger ribonucleic acid arrow pointing down lowercase a, b, Constitutive androstane receptor target genes arrow pointing down lowercase c and arrow pointing up lowercase b. Figure 4B1 is a set of one box plot graph and one western blot. The boxplot titled liver uppercase x receptor lowercase alpha plotting liver uppercase x receptor lowercase alpha per lowercase beta actin, ranging from 0.0 to 1.5 in increments of 0.5 (y-axis) across control plus saline, control plus epidermal growth factor, aroclor 1260 plus saline, and aroclor 1260 plus epidermal growth factor (x-axis). The western blot plotting control plus saline, control plus epidermal growth factor, aroclor 1260 plus saline, and aroclor 1260 plus epidermal growth factor (columns) across liver uppercase x receptor lowercase alpha and lowercase beta actin (rows). Figure 4B2 is a clustered box plot graph titled liver uppercase x receptor lowercase alpha plotting fold change, ranging from 0 to 3 in unit increments (y-axis) across liver uppercase x receptor lowercase alpha, Fatty acid synthase, Sterol regulatory element binding transcription factor 1, and Apolipoprotein E each includes, control plus saline, control plus epidermal growth factor, aroclor 1260 plus saline, and aroclor 1260 plus epidermal growth factor (x-axis) for liver uppercase x receptor lowercase alpha arrow pointing up lowercase c, liver uppercase x receptor lowercase alpha Messenger ribonucleic acid arrow pointing up lowercase a, c, and liver uppercase x receptor lowercase alpha target genes arrow pointing up a, c, arrow pointing down lowercase b. Figure 4C1 is a set of one box plot graph and one western blot. The box plot titled hepatocyte nuclear factor lowercase alpha plotting hepatocyte nuclear factor lowercase alpha per lowercase beta actin, ranging from 0.0 to 1.5 in increments 0.5 (y-axis) across control plus saline, control plus epidermal growth factor, aroclor 1260 plus saline, and aroclor 1260 plus epidermal growth factor (x-axis). The western blot plotting control plus saline, control plus epidermal growth factor, aroclor 1260 plus saline, and aroclor 1260 plus epidermal growth factor (columns) across hepatocyte nuclear factor lowercase alpha and lowercase beta actin (rows). Figure 4C2 is a clustered box plot graph titled hepatocyte nuclear factor lowercase alpha plotting fold change, ranging from 0.0 to 2.5 in increments of 0.5 (y-axis) across hepatocyte nuclear factor lowercase alpha, Pyruvate kinase, and Glucose-6-phosphatase each includes, control plus saline, control plus epidermal growth factor, aroclor 1260 plus saline, and aroclor 1260 plus epidermal growth factor (x-axis) for hepatocyte nuclear factor lowercase alpha protein arrow pointing up lowercase a, hepatocyte nuclear factor lowercase alpha Messenger ribonucleic acid arrow pointing down lowercase b, and hepatocyte nuclear factor lowercase alpha target genes arrow pointing up lowercase a arrow pointing down lowercase b. Figure 4D1 is a set of one box plot graph and one western blot. The boxplot titled Nuclear factor, Erythroid 2 per lowercase beta actin, ranging from 0.0 to 1.5 in increments of 0.5 across control plus saline, control plus epidermal growth factor, aroclor 1260 plus saline, and aroclor 1260 plus epidermal growth factor (x-axis). The western blot plotting control plus saline, control plus epidermal growth factor, aroclor 1260 plus saline, and aroclor 1260 plus epidermal growth factor (columns) across Nuclear factor, Erythroid 2, Sequestosome-1, and lowercase beta actin (rows). Figure 4D2 is a clustered box plot graph titled Nuclear factor, Erythroid 2 fold change, ranging from 0 to 5 in unit increments (y-axis) across Nuclear factor, Erythroid 2, NAD(P)H Quinone dehydrogenase 1, Malic enzyme 1, Glutamate-cysteine ligase catalytic subunit, Glutathione-disulfide reductase, and Glucose-6-phosphate dehydrogenase each includes, control plus saline, control plus epidermal growth factor, aroclor 1260 plus saline, and aroclor 1260 plus epidermal growth factor (x-axis) for Nuclear factor, Erythroid 2 protein arrow pointing down lowercase b, Nuclear factor, Erythroid 2 Messenger ribonucleic acid arrow pointing up lowercase a, and Nuclear factor, Erythroid 2 target genes acid arrow pointing up lowercase a arrow pointing down lowercase b.

Expression of select hepatic nuclear receptors, AhR, and NRF2 and their respective target genes in HFD-fed mice exposed to vehicle or Aroclor 1260±EGF treatment. Male WT C57Bl/6 mice were fed an HFD (12 wk) Aroclor 1260 (20mg/kg) by a one-time oral gavage at week 1. Aroclor 1260-exposed or vehicle mice were treated (via IP injection) with saline or EGF (0.2μg/g) daily for 10 d starting at week 10. Mice were fasted for 12 h and euthanized, and tissues were harvested for downstream analyses. (Ai–Di) Western blot analysis measuring hepatic (Ai) CAR, (Bi) LXRα, (Ci) HNF4α, (Di) NRF2, and p62 protein expression in mice gavaged with corn oil and injected with either saline (CS) or EGF (0.2μg/g) (CE) or gavaged with Aroclor 1260 (20mg/kg) and injected with saline (AS) or EGF (AE). (Aii–Dii) qPCR analysis measuring hepatic mRNA for (Aii) CAR and CAR/PXR target genes Cyp2b10/Cyp3a11, (Bii) LXRα and target genes Fasn, Srebf1, and Apoe, (Cii) Hnf4α and target genes Pklr, and G6pc (Dii) Nrf2 and target genes Nqo1, Me1, Gclc, Gsr, and G6pdh. An n=5 was used for the western blot analysis data, and an n=17 was used for all the qPCR data. A two-way ANOVA was used to statistically compare data sets followed by a Sidak correction for intergroup comparisons. A p<0.05 was considered significant. A p<0.05 is denoted by * for the Sidak multiple comparison test. Significance due to EGF is denoted by (a), due to Aroclor 1260 denoted by (b), and due to interaction denoted by (c) for the two-way ANOVA. Data are presented as box and whisker plots for Figure 4 that illustrate the median (midline), upper and lower quartiles (box), and the upper and lower limits (whiskers). All numerical data are presented in Table S6 “Numerical Data” as mean±SD and p-values can be found in Table S5. Numeric outliers were identified by ROUT method and removed. The number of outliers are reported in Table S4. Note: AE, Aroclor 1260+EGF; ANOVA, analysis of variance; Apoe, apolipoprotein E; AS, Aroclor 1260+saline; CAR, constitutive androstane receptor; CE, control+EGF; CS, control+saline; Cyp2b10, cytochrome P450 2B10; Cyp3a11, cytochrome P450 3A11; EGF, epidermal growth factor; Fasn, fatty acid synthase; HFD, high-fat diet; HNF4α, hepatocyte nuclear receptor 4-alpha; Gclc, glutamate-cysteine ligase catalytic subunit; Gsr, glutathione-disulfide reductase; G6pc, glucose-6-phosphatase; G6pdh, glucose-6-phosphate dehydrogenase; IP, intraperitoneal; LXRα, liver X receptor-alpha; NRF2, nuclear factor-erythroid 2-related factor 2; Me1, malic enzyme 1; Nqo1, NAD(P)H quinone dehydrogenase 1; Pklr, pyruvate kinase, liver type; PXR, pregnane xenobiotic receptor; p62, sequestosome 1; Srebf1, sterol regulatory element binding transcription factor 1.