. 2021 Mar 31;129(3):037010. doi: 10.1289/EHP8222

Figure 5.

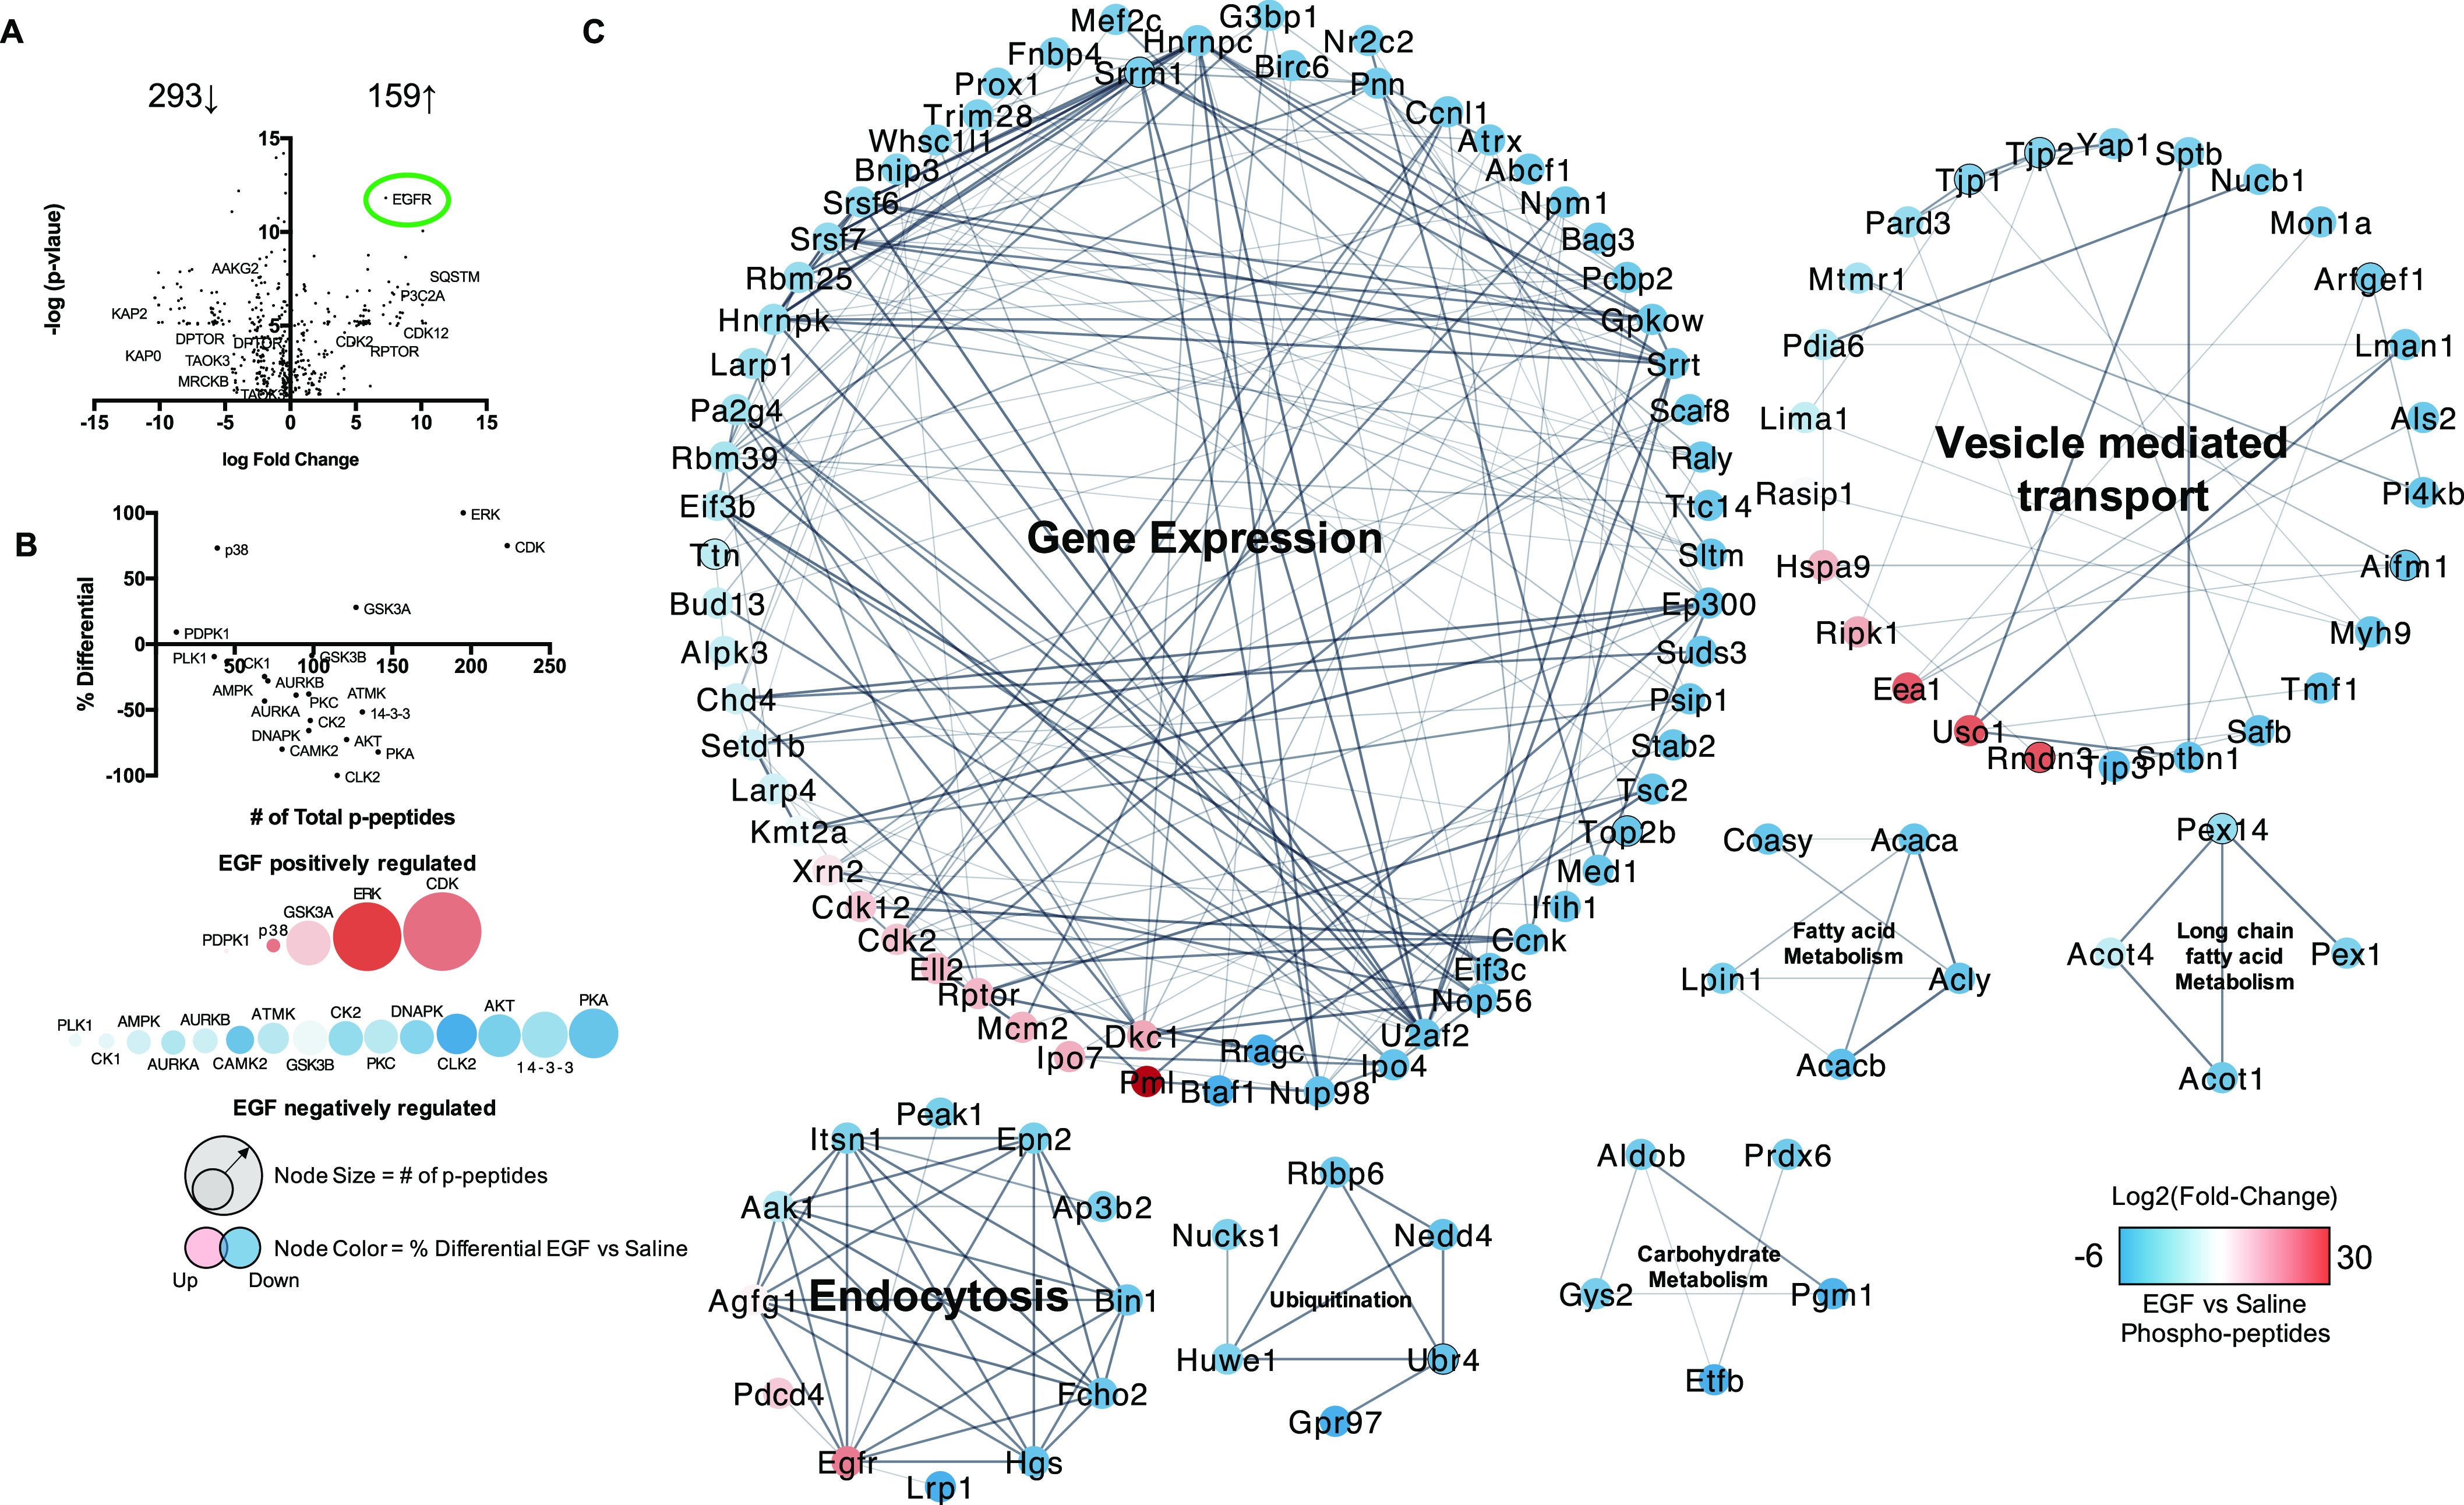
Figure 5A is a volcano plot plotting negative log (lowercase p), ranging from 0 to 15 in increments of 5 (y-axis) across log fold change, ranging negative 15 to 15 in increments of 5 (x-axis) for 293 arrow pointing down and 159 arrow pointing up. Figure 5B is a horizontal volcano plot plotting percentage differential, ranging from negative 100 to 100 in increments of 50 (y-axis) across number of total lowercase p peptides, ranging from 50 to 250 in increments of 50 (x-axis). The epidermal growth factor positively regulated is displayed in a series of circles with size small to big from left to right: 3-Phosphoinositide Dependent Protein Kinase 1, p38 mitogen-activated protein kinases, Glycogen Synthase Kinase 3 Alpha, Extracellular signal-regulated kinase, and cyclin-dependent kinase. Below, another series of circles with size small to big from left to right is displayed, representing Serine/threonine-protein kinase PLK1, casein kinase 1, AMP-activated protein kinase, Aurora Kinase A, Aurora Kinase B, calmodulin-dependent protein kinase 2, A T M K, Glycogen synthase kinase 3 beta, Casein kinase 2, Protein kinase C-(alpha), DNA-dependent protein kinase, C L K 2, Protein kinase B, 14-3-3, and P K A. The epidermal growth factor negatively regulated displays the following: A circle with an arrow is placed inside a circle representing node size equals number of lowercase p peptides and a Venn diagram titled up and down, respectively, is representing node color equals percentage differential epidermal growth factor versus saline. Figure 5C is a set of seven network analysis diagrams titled gene expression, vesicle mediated transport, fatty acid metabolism, long chain fatty acid metabolism, endocytosis, ubiquitination, and carbohydrate metabolism. The network analysis for gene expression lists the following proteins: G3b p1, Birc6, N r2c2, P n n, C c n l1, A t r x, A b c f1, N p m1, Bag3, P c b p2, G p k o w, S r r t, Scaf8, Raly, T t c14, S l t m, E p300, Suds3, P sip1, Stab2, T s c2, Top2b, Med1, I fih1, C c n k, Eif3c, Nop56, U2 a f2, I po4, Nup98, R rag c, B taf1, P m l, D k c1, I po7, M c m2, R p tor, E l l 2, C d k2, C d k12, X r n2, K m t2a, L a r p4, Setd1b, C h d4, A l p k3, Bud13, T t n, Eif3b, R b m39, Pa2g4, Larp1, H n r n p k, R b m25, S r s f7, S r s f6, B n I p3, W h s c 1l1, Trim28, Prox1, F n b p4, Mef2c, S r r m1, and H n r n p c. The network analysis for vesicle mediated transport lists the following proteins: Yap1, S p t b, N u c b1, Mon1a, A r f g ef1, L man1, A l s2, Pi4kb, Aifm1, M y h9, T m f1, Safb, S p t b n1, T j p3, R m d n3, U s o1, E e a1, Ripk1, H s p a9, Rasip1, Lima1, P d I a6, M t m r1, Pard3, T j p1, and T j p2. The network analysis for fatty acid metabolism lists the following proteins: Coasy, Acaca, L pin1, A c l y, and A c a c b. The network analysis for long chain fatty acid metabolism lists the following proteins: Pex14, Acot4, Pex1, and Acot1. The network analysis for endocytosis lists the following proteins: Peak1, E p n2, A p 3b2, Bin1, F c h o2, H g s, L r p1, E g f r, P d c d4, A g f g1, Aak1, and I t s n1. The network analysis for ubiquitination lists the following proteins: R b b p 6, Nedd4, U b r4, G p r97, Huwe1, and Nucks1. The network analysis for carbohydrate metabolism lists the following proteins: Aldob, P r d x6, P g m1, E t f b, and G y s2. A scale depicting log of 2 (fold change) and epidermal growth factor versus saline Phospho-peptides ranges from negative 6 to 30.

Characterization of the EGF-sensitive hepatic phosphoproteome and kinome: Male WT C57Bl/6 mice fed a control diet were treated with either saline or EGF (0.2μg/g), followed by euthanasia at 30 min post IP injection and liver resection for downstream phosphoproteomic analysis. (A) Volcano plot of log 2(fold-change) and -log(p-value) for hepatic phosphopeptides (EGF vs. saline) significantly changed with EGF (0.2μg/g) IP after 30 min. (B) Kinome analysis based on phosphopeptides significantly regulated by EGF administration in the liver. (C) Cluster and GO processes analysis of the significant EGF-sensitive Phosphopeptides (Clusters numbered 1–7). An n=5 was used for the acute phosphoproteomic study, and a p<0.05 was considered significant by a two-tailed t-test. Pathways and processes had to meet an FDR<0.05. Note: CE, control+EGF; CS, control+saline; EGF, epidermal growth factor; FDR, false discovery rate; GO, gene ontology; IP, intraperitoneal.