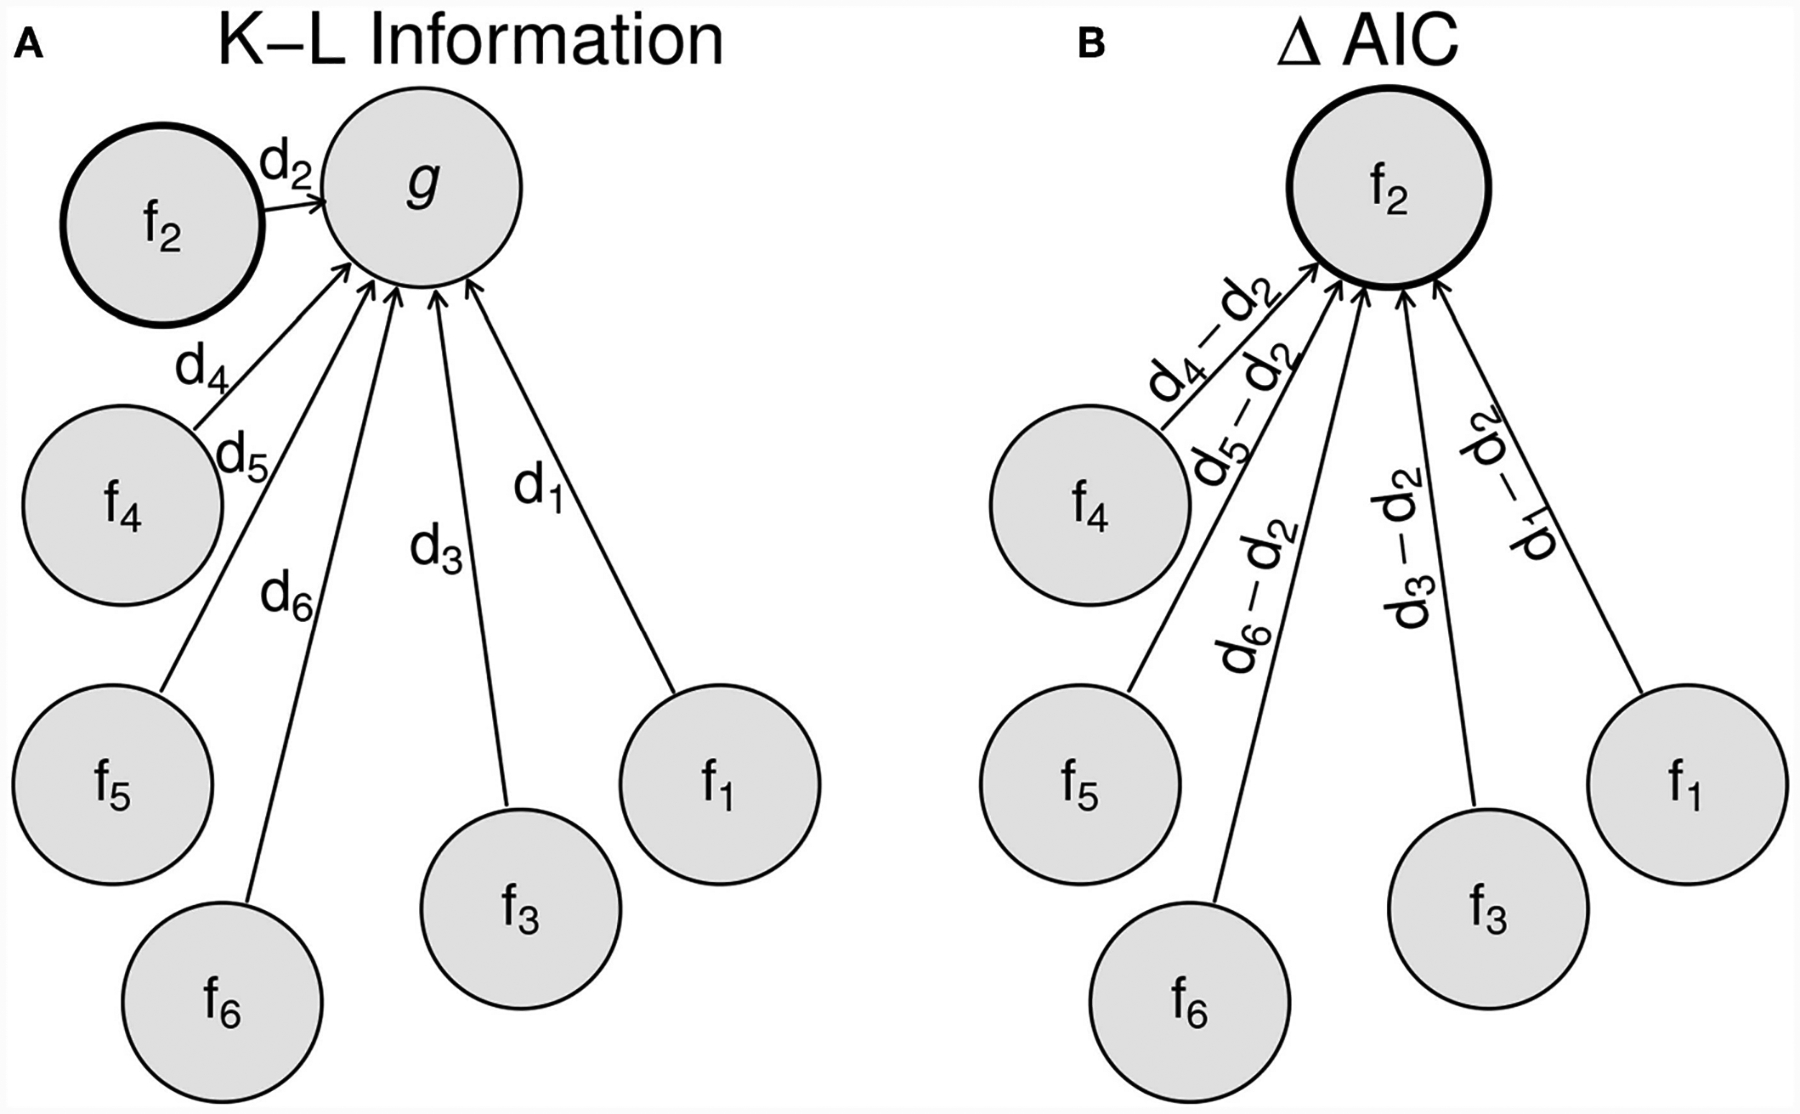
FIGURE 2 |.

Schematic representation of the logic of multi-model selection using the AIC. g represents the generating model and fi the ith approximating model. The Kullback-Leibler information discrepancies (di) are shown on the left (A) as the distance between approximating models and the generating model. The ΔAICs shown on the right (B) measures the distance from approximating models to the best approximating model. All distances are on the information scale.
