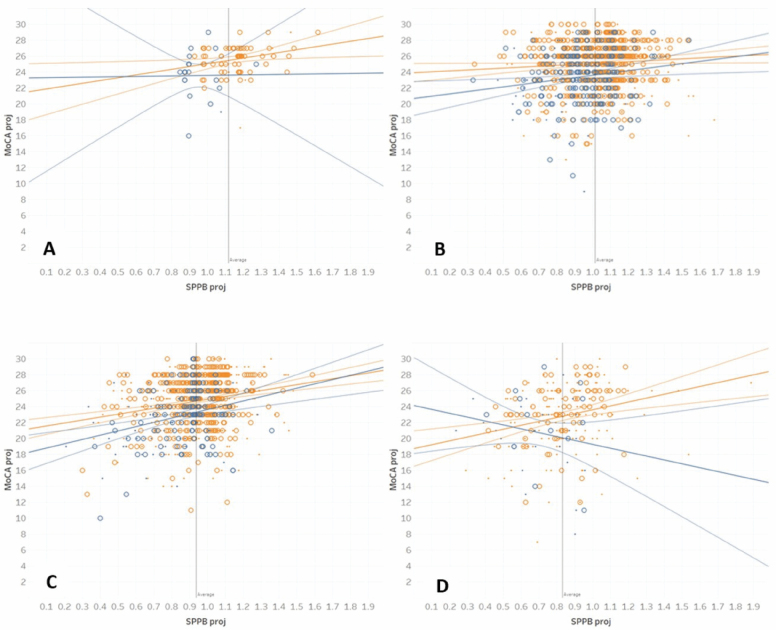
Figure 2.
Scatterplots of projected MoCA and SPPB 4-m gait speed for participants in the following age groups: (A) 50–59, (B) 60–69, (C) 70–79, and (D) 80 or above. Orange = White, Blue = African American; small dot = BMI < 30, large dot = BMI > =30. Straight lines indicate linear regression and curve lines 95% confidence limits.

