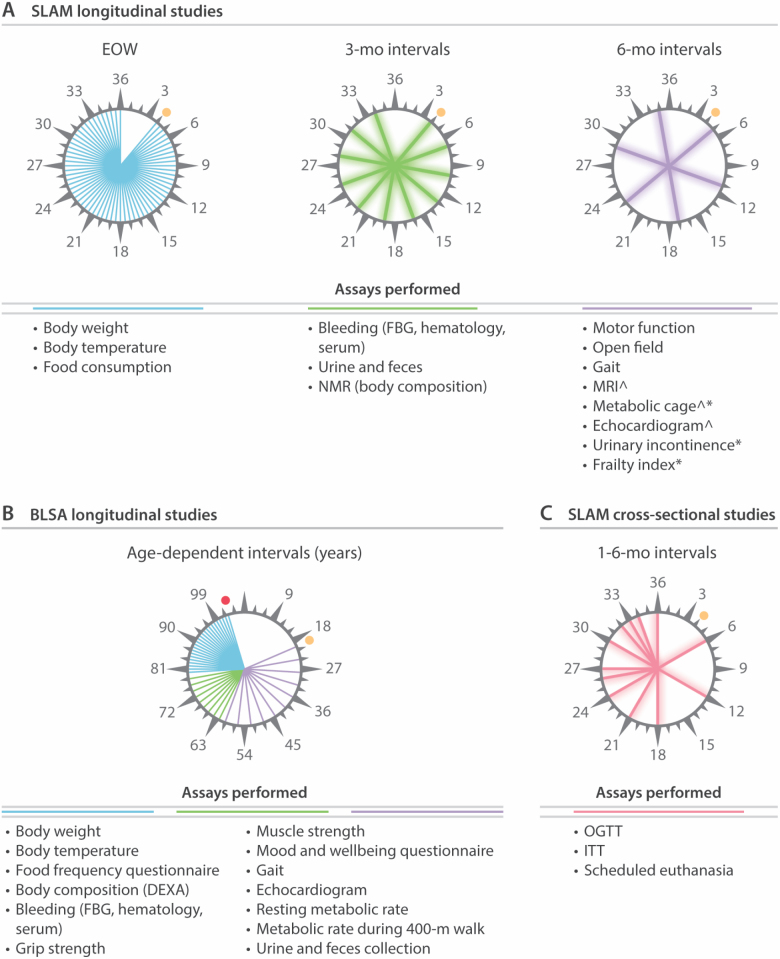
Figure 2.
Study design for SLAM and corresponding measurements performed in BLSA. (A) Schematic representation of the longitudinal measurements performed in SLAM and the frequency of testing. *The frequency of these tests was increased after 15 months of age. ^Selected animals only. (B) Schematic representation of the BLSA equivalents to measurements performed in SLAM and the frequency with which these were performed. (C) Schematic representation of the timing and measurements performed in the cross-sectional arm of SLAM. FBG = fasting blood glucose; NMR = nuclear magnetic resonance; MRI = magnetic resonance imaging; OGTT = oral glucose tolerance test; ITT = insulin tolerance test; DEXA = dual-energy X-ray absorptiometry. Orange circles indicate the initiation of studies. Red circle indicates the oldest participant of BLSA (103 years).

