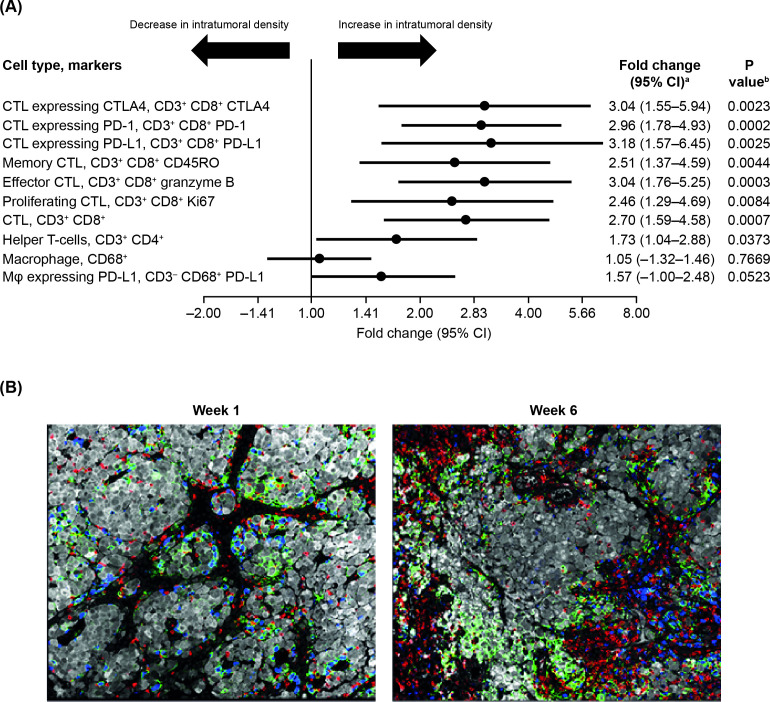
Figure 2.
(A) Changes in intratumoral density of immune cell subsets from baseline to week 6 in non-injected lesions (based on 25 paired baseline to week 6 biopsies). (B) Immunofluorescence image examples from non-injected melanoma lesions, before and after starting treatment with T-VEC (from a patient exhibiting a durable response). CD3+ T-cells are shown in red; CD68+ macrophages in blue; PD-L1 cells in green; and S100+ melanoma cells in gray. aFold increase from baseline to week 6, analyzing number of positive cells per square millimeter within the tumor region. bP values were calculated using a visit level contrast from a linear model of visit and subject ID, where immunofluorescence results (based on 25 paired baseline/week 6 biopsies) were first transformed with a base 2 version of arcsinh: log2((z + (z2+1)1/2)/2). CTLA-4, cytotoxic T-lymphocyte antigen-4; CTL, cytotoxic T-lymphocyte; PD-L1, programmed death-ligand 1; T-VEC, talimogene laherparepvec.

