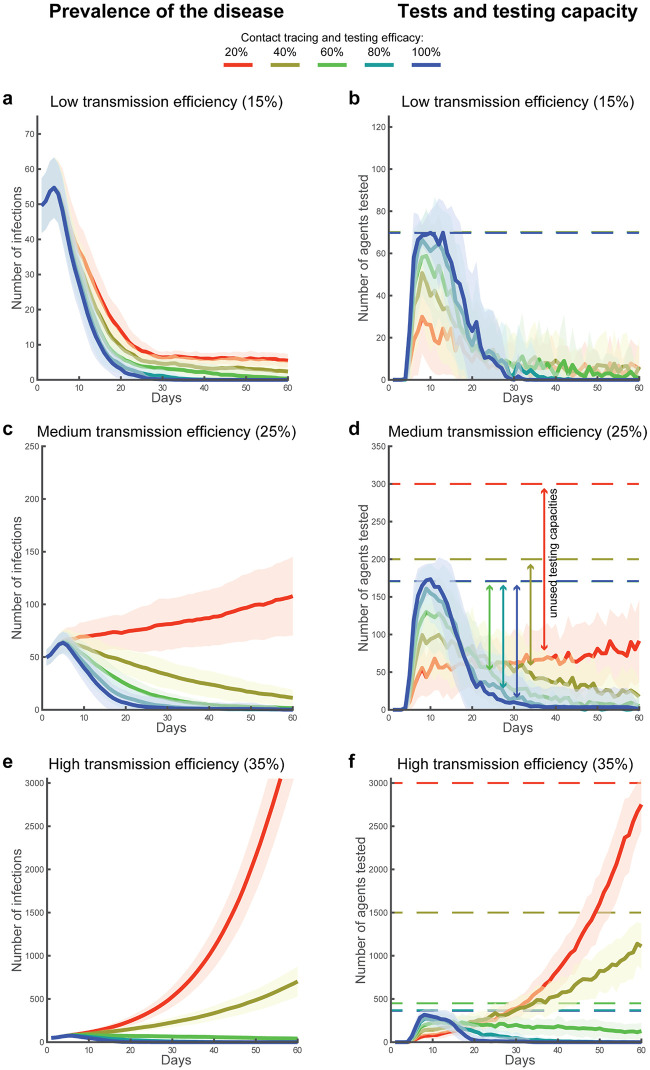
Fig 4. Disease prevalence, agents tested and capacity.
Error bands (mean and standard deviation) represent the prevalence of COVID-19 in the population over 60 days of simulated time (a, c, e), and the associated number of daily tested agents in relation with the respective testing capacities (solid and dotted lines respectively in b, d, f). The 3x5 design was used to simulate three conditions of simulated transmission efficiency, e.g., due to different mitigation strategies in place, which regulated the growth in the number of infections (a-b: 15%, c-d: 25% and e-f: 35%), and five conditions of contact tracing and testing efficacy (100%, 80%, 60%, 40% and 20%). These simulations illustrate the dynamics found across all conditions of symptomatology in the population distribution and across all conditions of secondary infection cluster size. For these simulations, the percentage of asymptomatic/paucisymptomatic infections is fixed at 20% and the size of the secondary infection cluster is fixed to 1 across all agents (i.e., deterministic setting).

