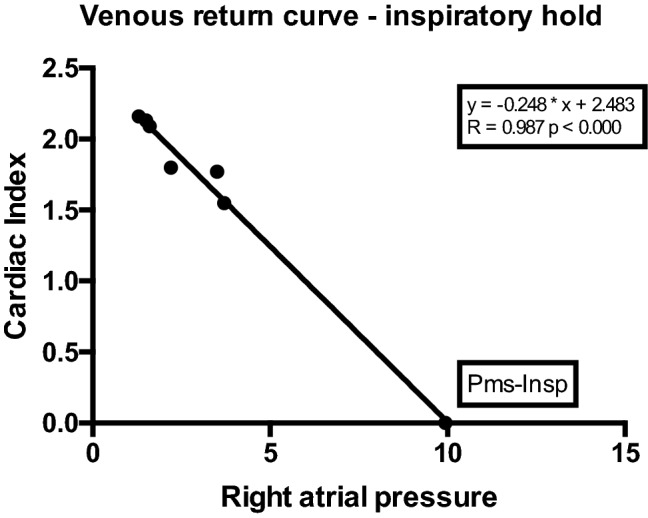
Fig. 1.

Example of venous return curve. Data points plotted represent consecutive cardiac index (CI) (y-axis) and corresponding right atrial pressure (RAP; x-axis) values during 12 s inspiratory hold maneuvers. With each increment of airway plateau pressure (Pplateau), CI (or venous return; VR; as in steady state conditions VR determines CI) will decrease, whereas RAP will increase. Pms-Insp (Pms calculated after inspiratory hold maneuver) is calculated by extrapolation of the VR-curve with linear regression (least squares method). The intersect of the VR-curve with the x-axis (at zero CI or VR) represents true Pms-Insp
