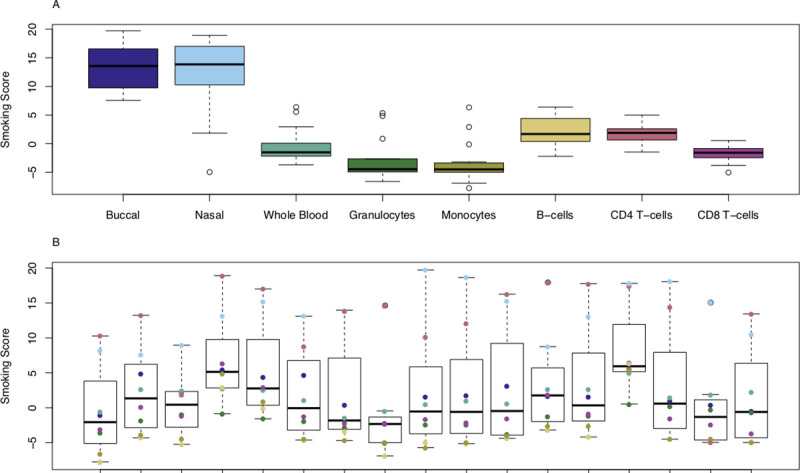
Fig 3. Smoking scores derived from DNA methylation data vary across different sample types from the same individual.

A) Boxplots of estimated exposure to tobacco smoking grouped by cell or tissue type. Smoking score predictions for each sample-type had a mean range of 12.1 (SD = 4.24). B) Boxplots of estimated exposure to tobacco smoking grouped by individual, where the color indicates the value derived from a specific sample type. Smoking score predictions for each individual had a mean range of 11.5 (SD = 6.21).
