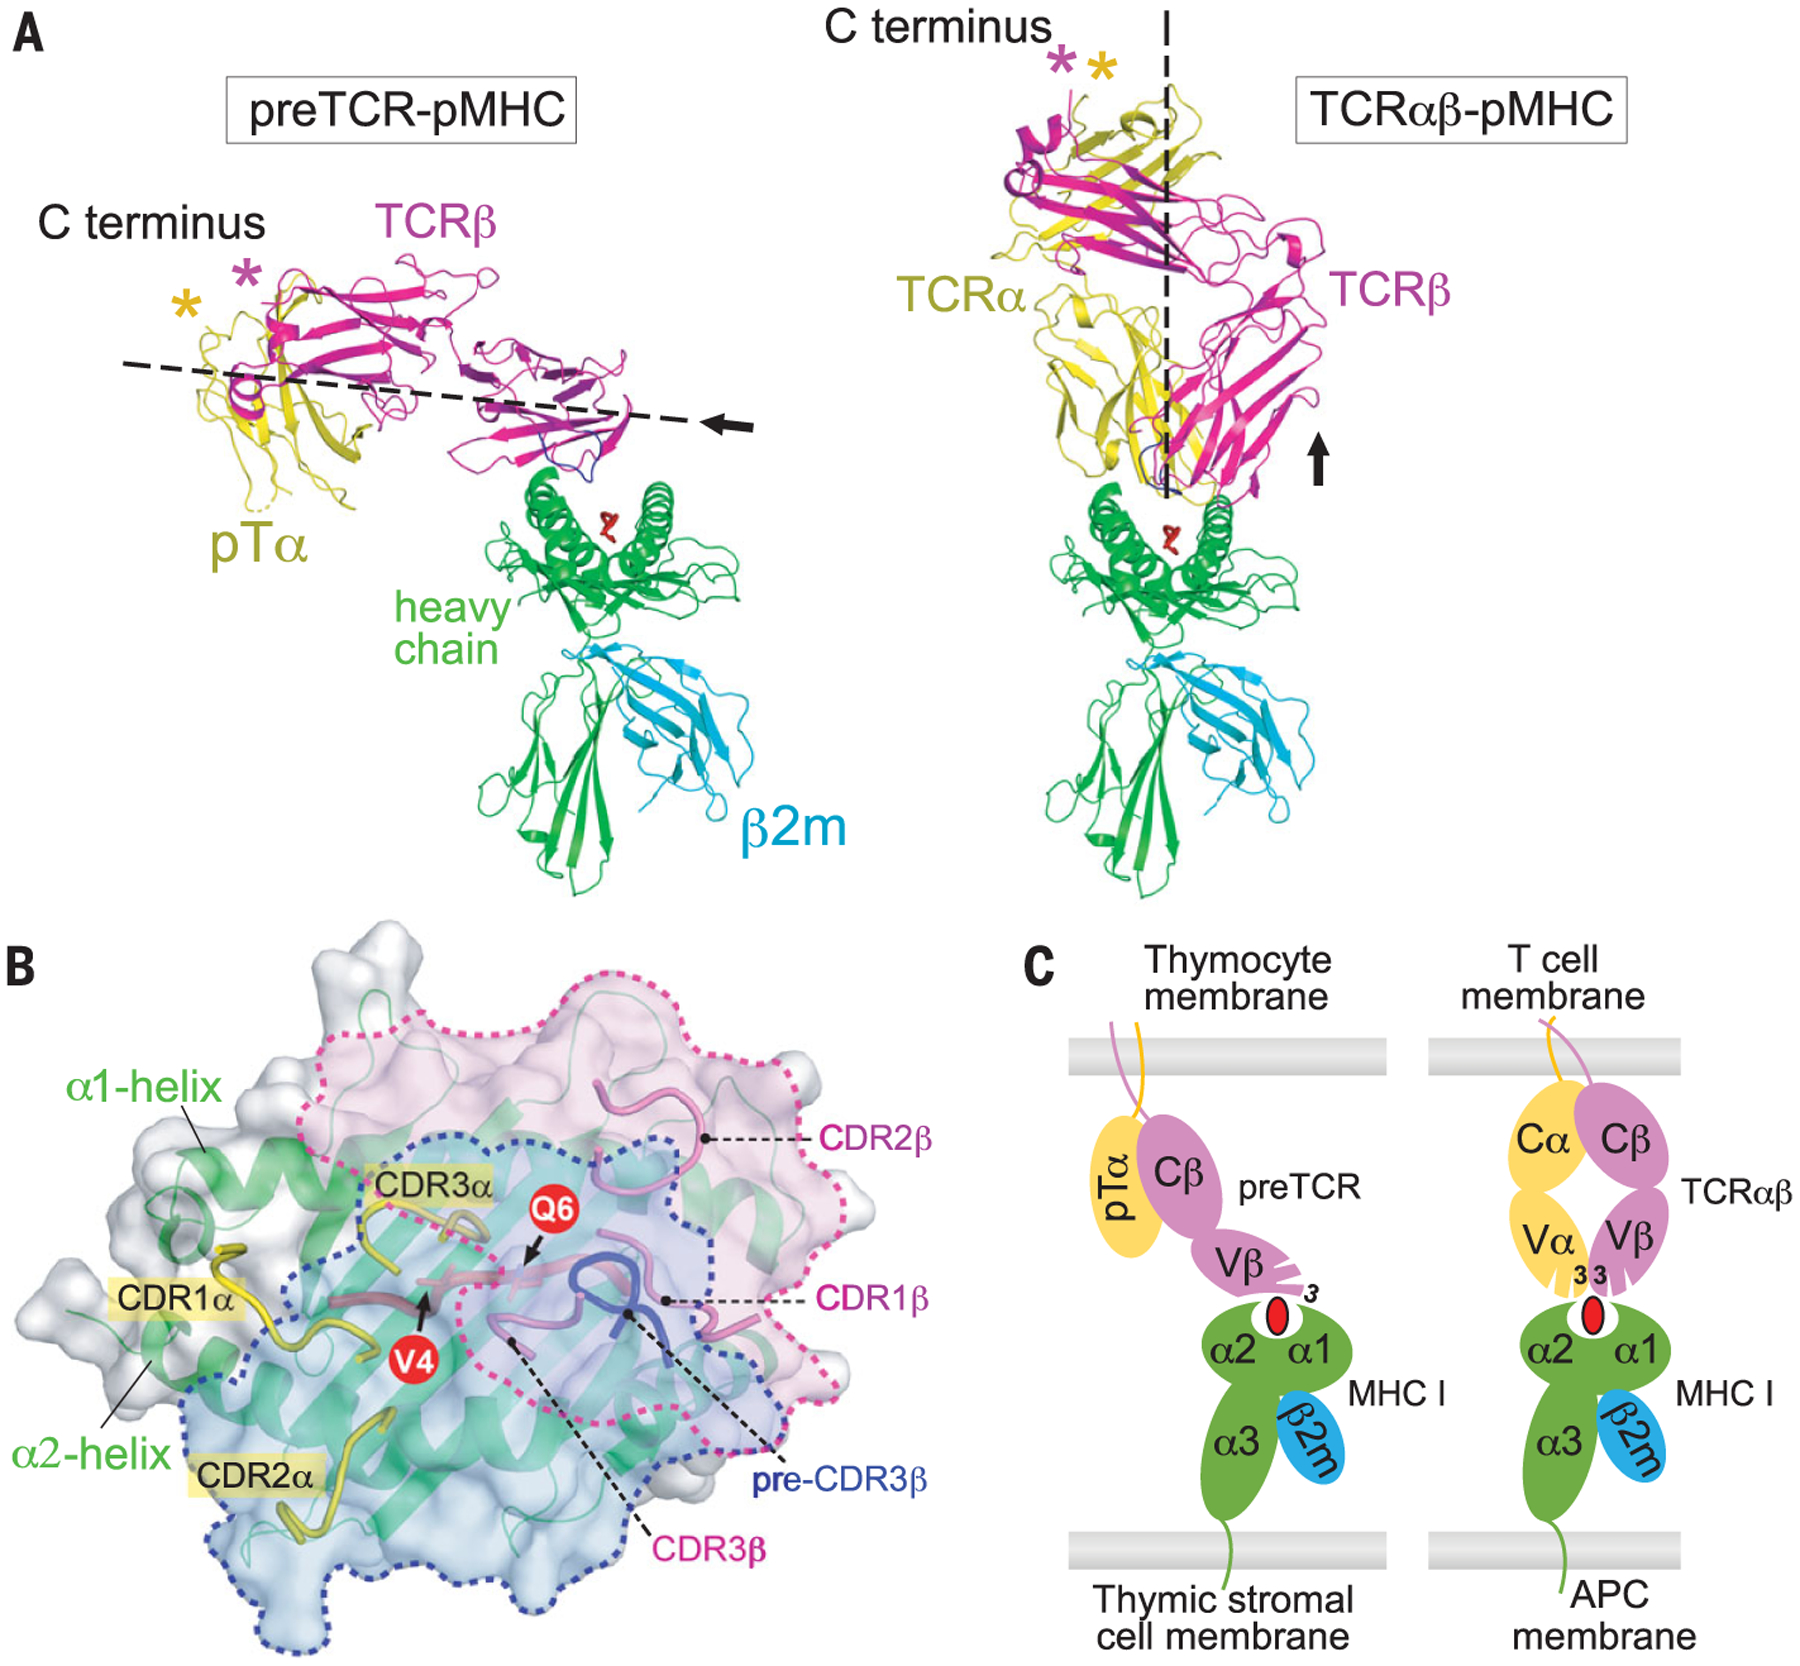
Fig. 2. Distinct pMHC-binding mode of preTCR versus TCRαβ.

(A) Side-by-side ribbon drawings of the “horizontal” N15preTCR–VSV8–Kb complex model (left) and “vertical” N15TCRαβ–VSV8–Kb complex structure (right) (31). The former was constructed by overlaying structures of human preTCR (PDB: 3OF6) and mouse VSV8-Kb (PDB: 1KPU) onto the current structure of N15β–VSV8–Kb-t2. (B) Composite view of the footprints of a TCRαβ (PDB: 2CKB) and the preTCR on the same Kb (gray surface and green ribbon). The β-chain footprints of TCRαβ and preTCR are delineated by magenta and blue dashed lines, respectively. All CDR loops are displayed. The VSV8 is in red ribbon representation with its exposed residues V4 and Q6 shown. (C) Simplified illustration of pMHC binding of preTCR versus TCRαβ.
An atomistic model comparison is provided in fig. S6. Only CDR3 is labeled. APC, antigen-presenting cell.
