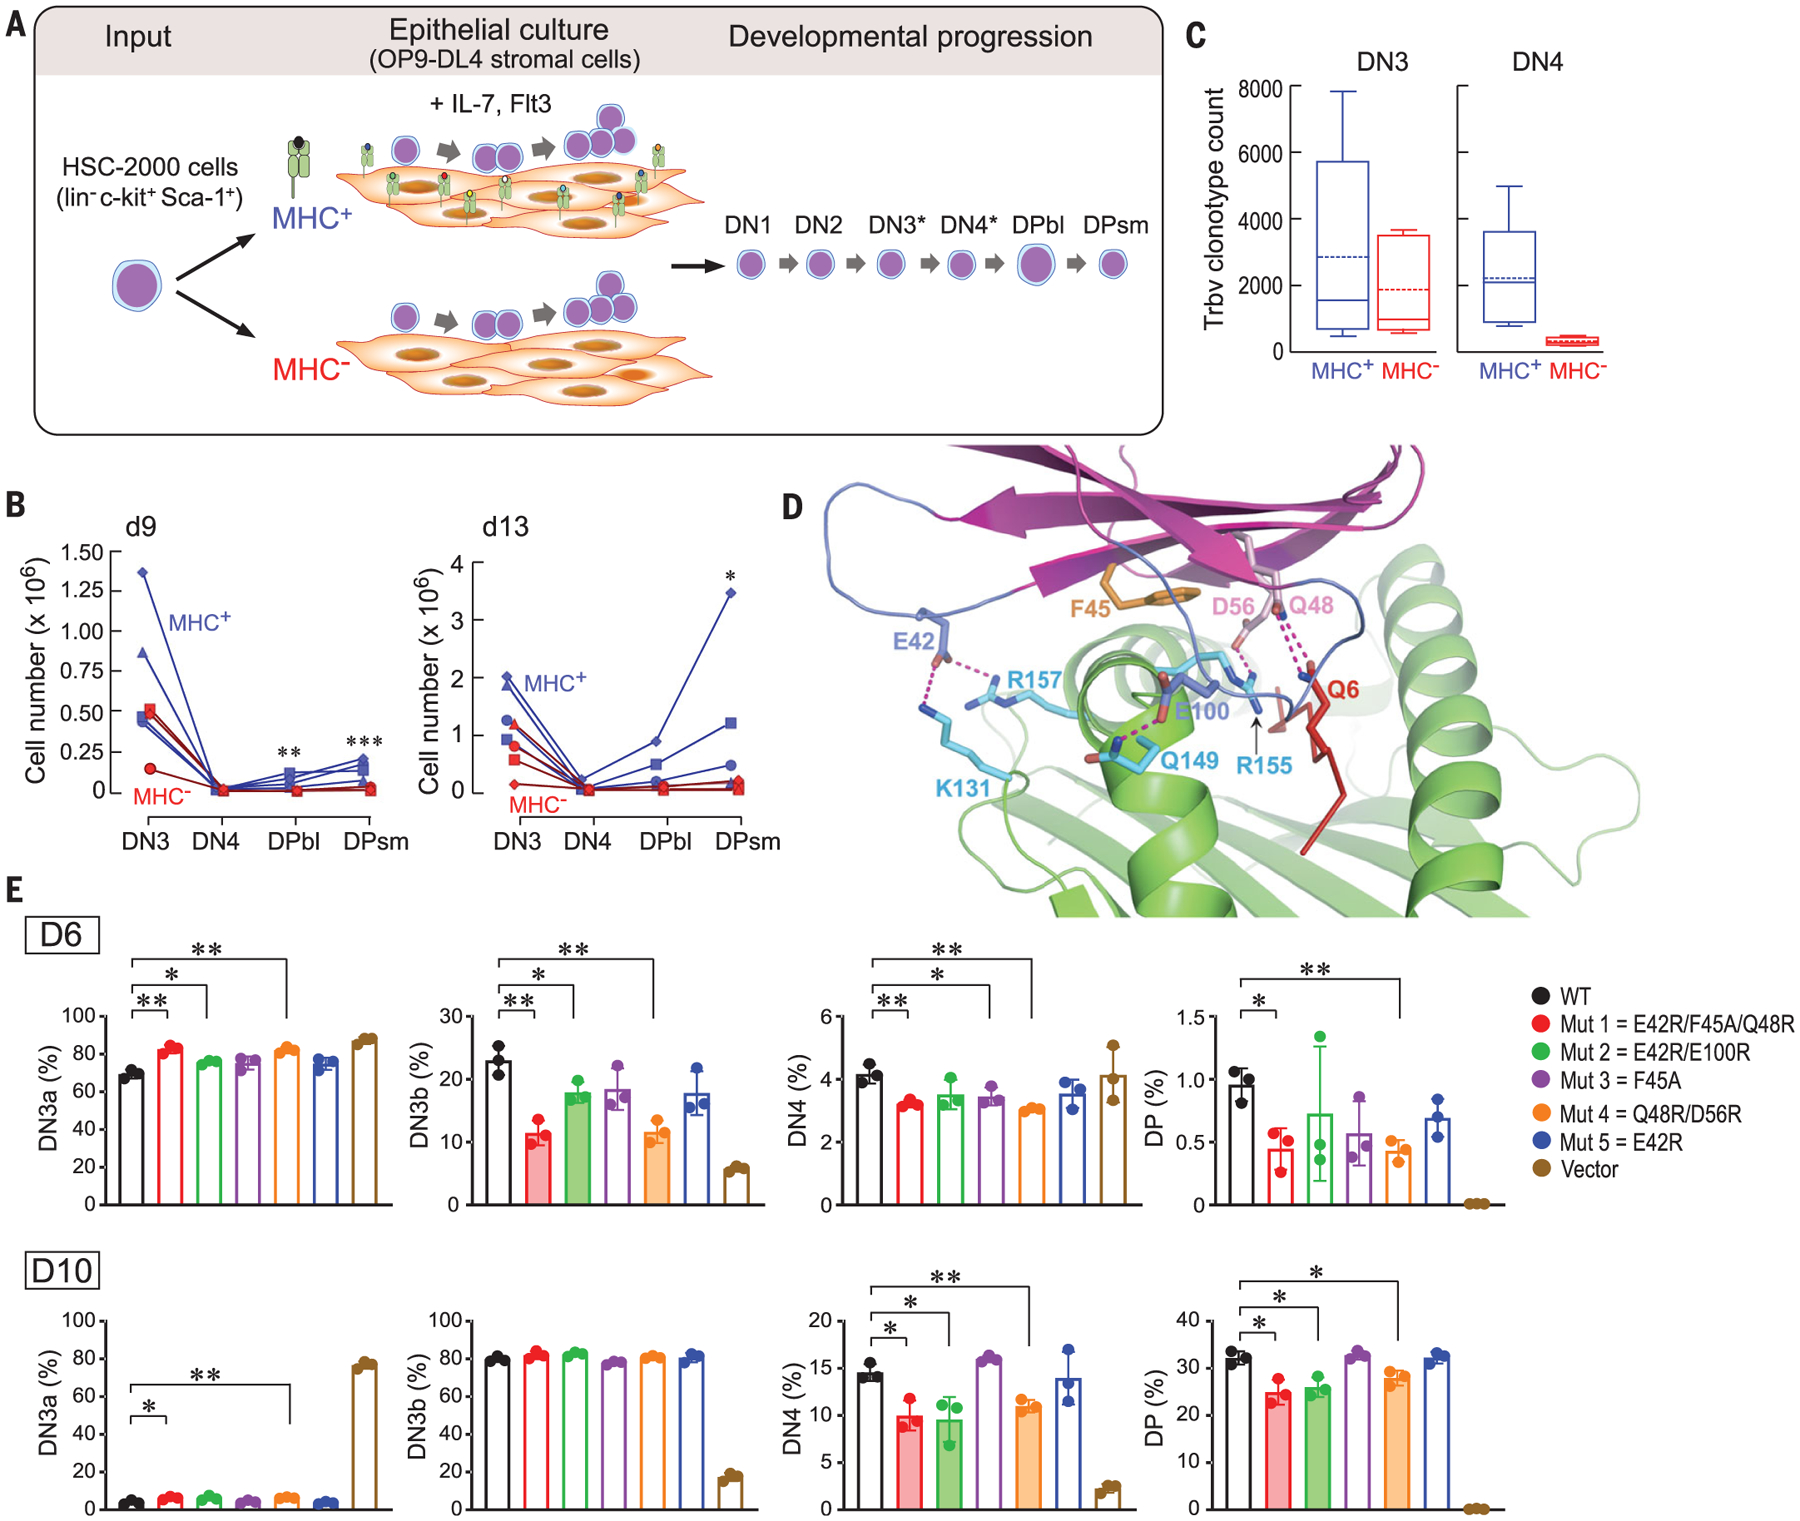
Fig. 4. Impact of preTCR-pMHC interactions on β-chain repertoire expansion.

(A) Schematic for thymocyte development. B6 hematopoietic stem cells (HSCs) (light blue and magenta) were cultured on OP9-DL4 cells (light brown) expressing or lacking MHC. For simplicity, the numerically minor immature single-positive thymocytes before DP blast (DPbl) are omitted, with subpopulations expressing preTCRs starting at DN3 and persisting through DN4 denoted by asterisks. (B) Thymocyte cell number per stage [DN3 to DPsmall (DPsm)] at d9 and d13 after HSC seeding (2000 cells) on MHC+ or MHC− OP9-DL4 stromal cells. Each symbol represents an independent experiment (n = 4). *P < 0.05; **P < 0.02; ***P < 0.01, two-tailed Student’s t test. (C) PreTCR β-chain unique clonotype representation in 104 DN3 and DN4 cells after 9 days of growth on MHC+ or MHC− stromal cells. For each condition, the box bounds the 25th and 75th percentile with the internal 50th percentile (solid line) and mean (dotted line). Whiskers with bars define upper and lower values for each condition (n = 5). For DN4, P < 0.05 for the comparison of MHC+ and MHC− conditions. (D) Key interface contacts in the N15β–VSV8–Kb-t2 structure used for mutagenesis studies in (E). (E) Top row highlights the DN3a-DN3b transition and the bottom row shows later DN4 and DP changes (n = 3). *P < 0.05; **P < 0.01, two-tailed Student’s t test. DN3a, DN3b, and DN4 percentages were derived by gating on the CD4−CD8−CD44− population (fig. S12). Shading indicates interface mutants that significantly inhibited thymocyte developmental progression.
