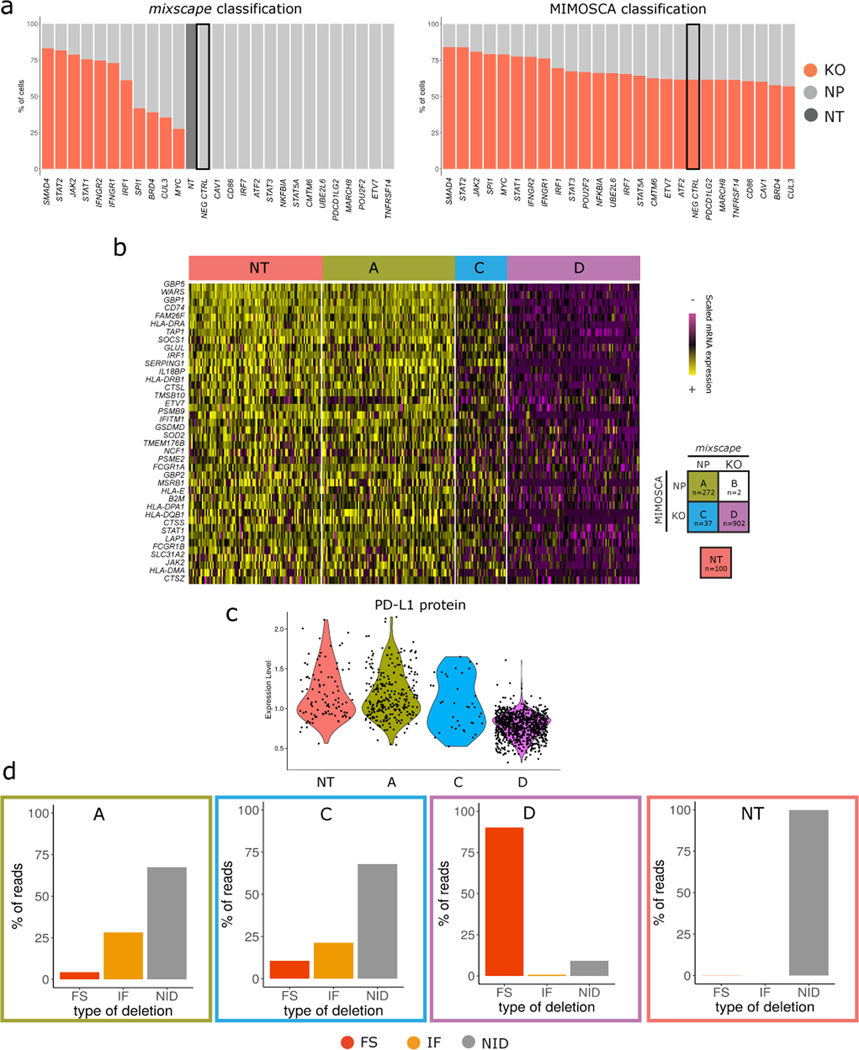
Extended Data Fig. 5. Benchmarking mixscape against MIMOSCA.
(A) Top: Barplots showing the % of KO (red) and NP (light grey) cells within each gRNA class as classified by mixscape, and MIMOSCA (Bottom). To assess the potential for overfitting, prior to running the dataset, we randomly sampled 1,000 cells expressing NT gRNA and re-labeled them as a new targeted gene class, representing a negative control (NEG CTRL, marked with a black box). Only mixscape correctly classifies all of these cells as NP.
(B) Single-cell mRNA expression heatmap with IFNGR2g2 cells being grouped by mixscape and MIMOSCA classification. Cells classified by both methods as KO (Class ‘A’) exhibit downregulation of IFNγ pathway genes, while cells classified by both methods as ND (Class ‘D’) resemble NT controls. When mixscape classifies cells as NP and MIMOSCA classifies as KO (Class C), cells resemble NT controls, suggesting that the mixscape classification is correct. Class B (2 cells total) was removed for visualization due to low cell number.
(C) Violin plots showing PD-L1 protein expression in IFNGR2g2 cells grouped by their MIMOSCA and mixscape classification (see legend in (B)). Class C cells resemble NT controls, suggesting that the mixscape classification is correct.
(D) Barplot showing the % of reads with no INDELS (grey), inframe (orange) and frameshift (red) mutations across all MIMOSCA and mixscape IFNGR2g2 cell classifications. Class C cells resemble NT controls, suggesting that the mixscape classification is correct (n==20,729 cells over 3 viral transduction replicates).

