
Fig. 3.
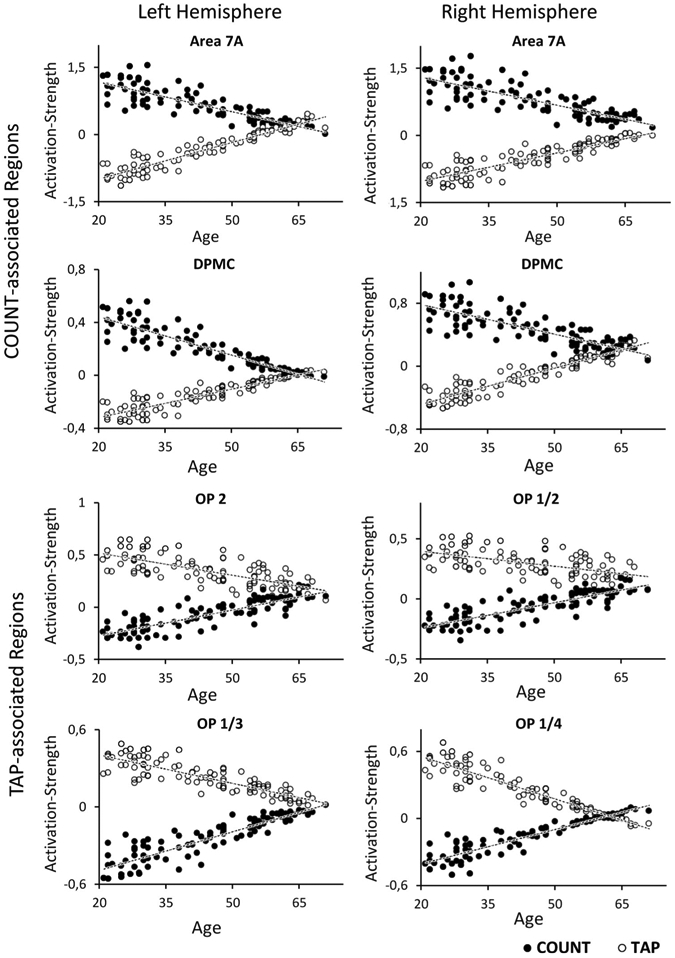
Dependence of brain activation on age in task-associated brain regions for both experimental conditions (TAP and COUNT). The activation strength reflects the beta-value of the voxel with the highest activation (maxima) in the respective cluster for each single subject. Each single dot therefore mirrors the change in BOLD signal by the respective condition in a single subject. COUNT-associated regions are represented by the four upper plots, whereas TAP-associated regions are represented by the four lower plots