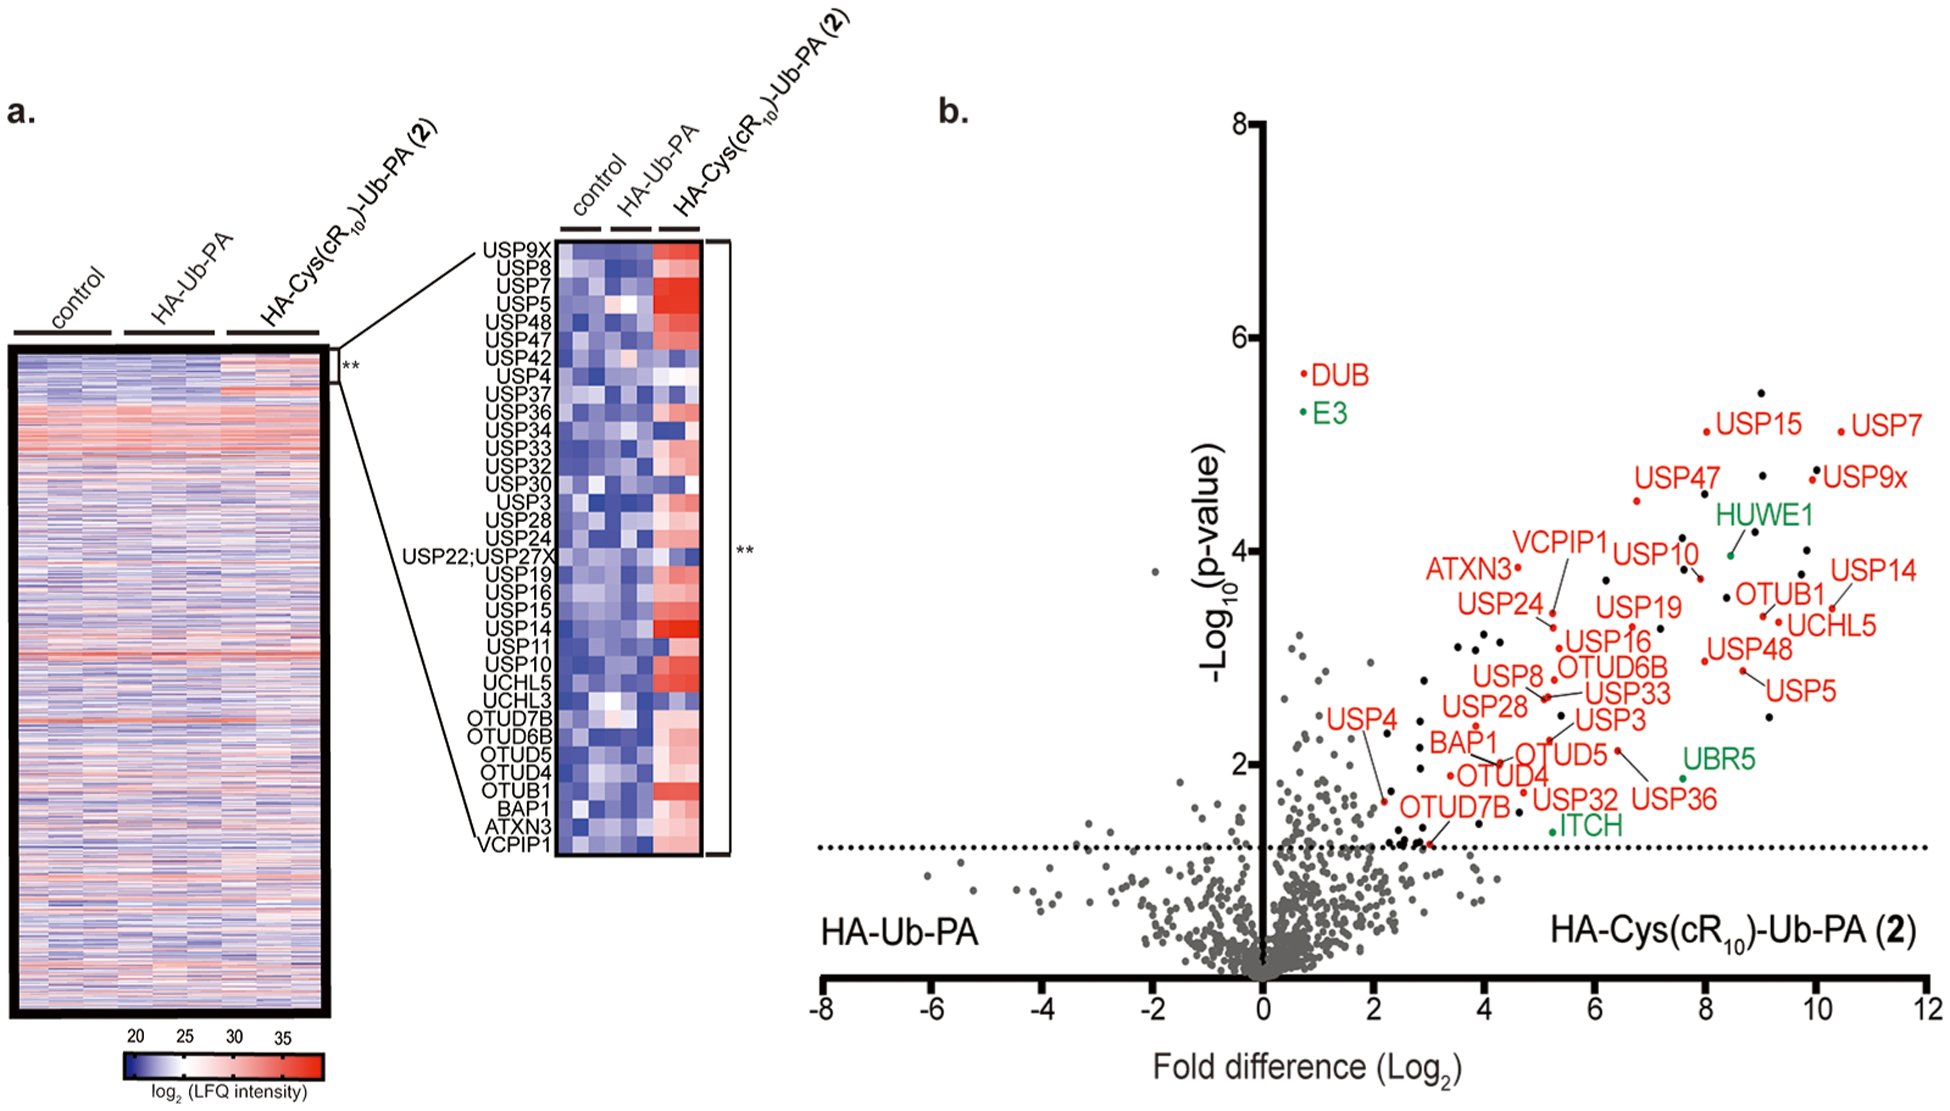
Figure 7.

Identification of pulled-down DUBs from HeLa cells treated with 15 μM HA-Cys(cR10)-Ub-PA (2) for 4 h analyzed using MS-based LFQ. (a) Heat map representing the LFQ intensity scores of 1114 identified protein groups from samples corresponding to the control, cellular treatment of 15 μM HA-Ub-PA, or cellular treatment of 15 μM HA-Cys(cR10)-Ub-PA (2). Each subcolumn contains repeats for each of the pulldown. Asterisks (**) denote the region corresponding to the DUBs. Inset shows a zoomed-in view of the DUBs within the heat map. Red represents enrichment (higher LFQ intensity (log2)), where lack of enrichment (lower LFQ intensity (log2)) is shown in blue. (b) Volcano plot of pairwise comparison of protein groups pulled down with HA-Cys (cR10)-Ub-PA (2) relative to HA-Ub-PA.
