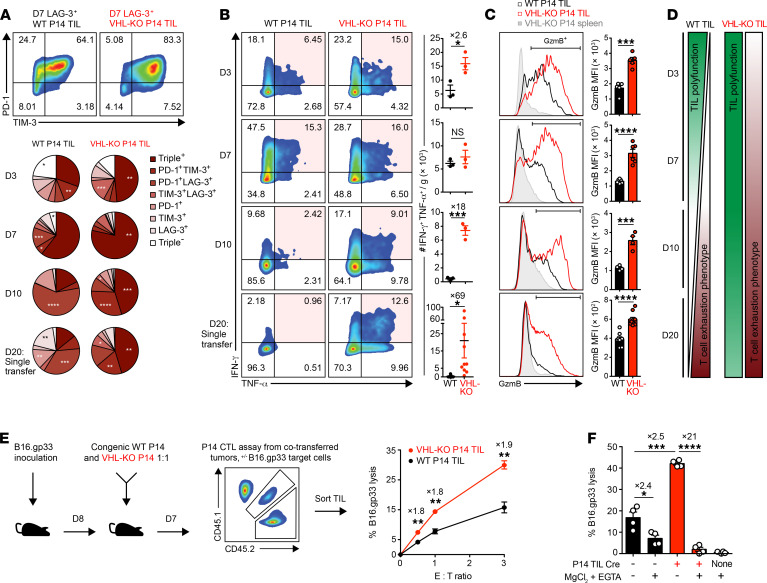
Figure 3. VHL-deficient P14 TILs retain polyfunctional antitumor cell responses despite elevated exhaustion-associated markers.
(A) Coexpression of exhaustion-associated markers PD-1, TIM-3, and LAG-3 by donor P14 TILs recovered in Figure 2A. Representative flow cytometry plots of PD-1 and TIM-3 expression gated on LAG-3+ cells (top). Pie charts indicate accumulation of exhaustion markers on days 3–10 after cotransfer and on day 20 after single transfer. (B and C) IFN-γ and TNF-α coproduction (B) and granzyme-B (GzmB) expression (C) by donor TILs recovered as in A after restimulation with gp33 peptide. Representative flow cytometry plots (left) and quantification of donor cell numbers (B) and MFI (C). (D) Graphical presentation of TIL polyfunctionality (green) and tumor-induced T cell exhaustion (red) for WT and VHL-KO donor TILs. (E) Specific lysis at indicated effector-to-target ratios of B16.gp33 target cells by sorted donor P14 TIL populations recovered on day 7 after cotransfer as in A, n = 6 per condition. (F) Dependence of CTL-mediated target cell lysis on granzyme-B/perforin pathway, n = 4 per condition. Data are representative of 3 (A–D) and 2 (E and F) independent experiments. Bars, line charts, and error bars represent mean ± SEM. NS, not significant, *P < 0.05, **P < 0.01, ***P < 0.001, ****P < 0.0001 (2-tailed Student’s t test in A–E, 1-way ANOVA with Bonferroni correction for multiple comparisons in F).

