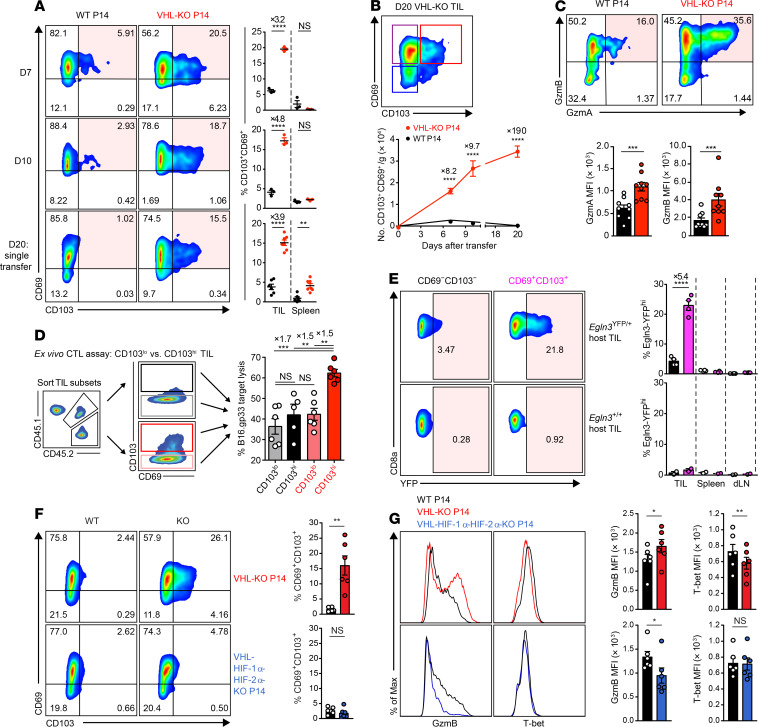
Figure 4. HIF promotes CD69+CD103+ Trm-like CD8+ TILs with higher cytolytic capacity against target cancer cells.
(A) Representative flow cytometry (left) and frequency (right) of CD69 and CD103 expression on WT and VHL-KO P14 cells after cotransfer (days 7, 10) or single transfer (day 20) into B16.gp33-bearing mice. n = 3 (days 7–10), n = 6 WT, and n = 7 VHL-KO (day 20). (B) CD69 and CD103 expression on VHL-KO TILs on day 20 (top) and absolute number of CD69+CD103+ donor TILs over time (bottom). n = 7 (day 10), n = 6 (days 7 and 20). (C) Representative flow cytometry (top) and MFI (bottom) of granzyme-A and granzyme-B expression on WT and VHL-KO TILs after cotransfer into B16.gp33-bearing hosts, n = 9. (D) Specific target cell lysis at 1:1 effector-to-target ratio by indicated sorted CD103lo and CD103hi donor P14 TIL subsets recovered on day 7 as in A, n = 6. (E) YFP signal in polyclonal CD69–CD103– and CD69+CD103+ CD8+ Egln3-YFP-KI (Egln3YFP/+) and control (Egln3+/+) TILs stained on day 13 following B16.gp33 challenge (left) and quantification of YFP signal (right), n = 4 for Egln3YFP/+ and n = 2 for Egln3+/+. (F) Representative flow cytometry (left) and frequency (right) of CD69 and CD103 on donor TILs 7 days after cotransfer of WT and VHL-KO P14 cells (top) or WT and VHL-HIF1α-HIF-2α-KO P14 cells (bottom), n = 6 VHL-KO/WT and n = 5 VHL-HIF1α-HIF-2α-KO/WT. (G) Representative flow cytometry (left) and MFI (right) of granzyme-B and T-bet expression on P14 TIL populations recovered as in F. Data shown as mean ± SEM are representative of 4 (A), 2 (B and C), and 3 (D–F) independent experiments. NS, not significant, *P < 0.05, **P < 0.01, ***P < 0.001, ****P < 0.0001 (1-way ANOVA with Bonferroni correction for multiple comparisons in D, 2-tailed Student’s t test in others).

