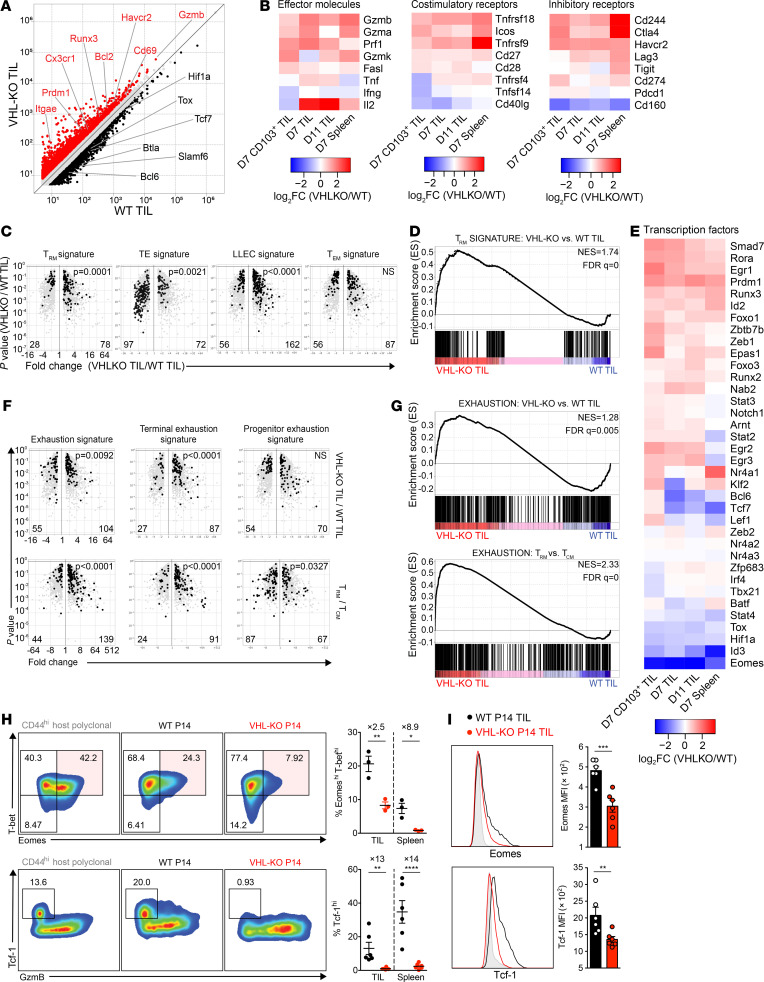
Figure 5. Expression of the Trm and T cell exhaustion gene expression signatures by VHL-deficient P14 TILs.
(A) Relative gene expression by VHL-KO and WT day 11 P14 TILs. Red and black denote an increase of 1.5-fold or greater in expression by VHL-KO over WT TILs or vice versa, respectively. (B and E) Changes in gene expression between VHL-KO and WT P14 for day 7 CD103+ TILs, days 7 and 11 bulk TILs, and day 7 spleen. (C) Volcano plots showing gene expression enrichment for Trm, TE, LLEC, and Tem signature genes from published datasets (25, 45) by VHL-KO versus WT D11 TIL. Genes with less than 1.5-fold change in expression were excluded. (D) GSEA of Trm signature in VHL-KO versus WT D11 TILs. (F) Comparison of T cell exhaustion signatures for Trm, TE, LLEC, and Tem between VHL-KO and WT D11 TILs (top) and small intestine intraepithelial P14 Trm relative to spleen P14 Tcm (45) (bottom). Genes with less than 1.5-fold change in expression were excluded. (G) GSEA of T cell exhaustion signature in VHL-KO versus WT D11 TILs and P14 Trm versus P14 Tcm. (H) Representative flow cytometric analysis (left) and quantification (right) of CD8+CD44+ VHL-KO and WT P14 TILs for T-bet, Eomes, Tcf-1, and granzyme-B. Data are representative of 3 independent experiments (n = 3 for Eomes and T-bet coexpression; n = 6 for Tcf-1). (I) Representative histograms of Eomes and Tcf-1 expression (left) and MFIs (right) in cotransferred donor P14 TIL populations. Overexpressed gene counts are shown at bottom of volcano plots, and statistical P values denote comparisons between indicated groups. Error bars represent mean ± SEM. *P < 0.05, **P < 0.01, ***P < 0.001, ****P < 0.0001 (Student’s t test in H and I). FC, fold change; NS, not significant; NES, normalized enrichment score; FDR q value, FDR corrected P value.

