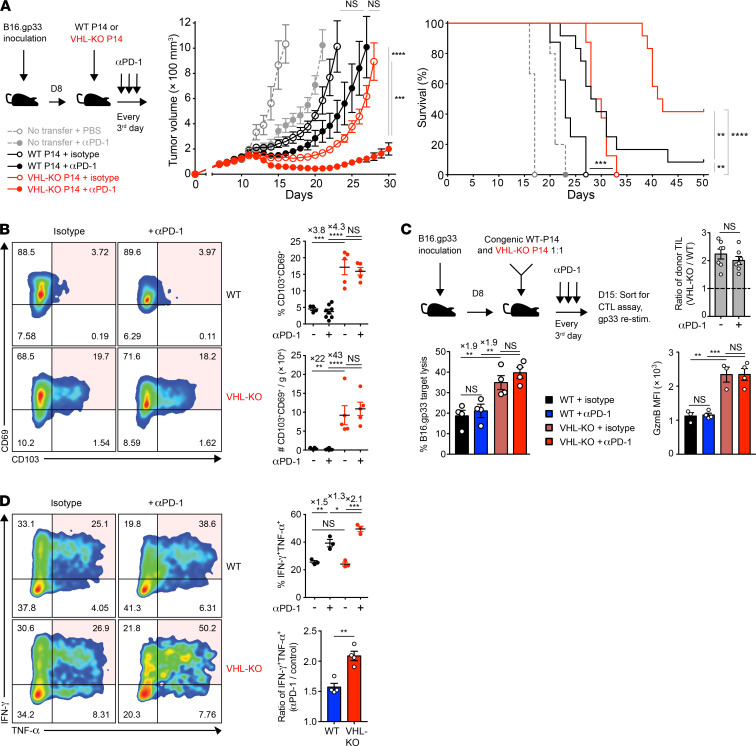
Figure 6. Immunotherapy with anti–PD-1 improves response to established tumors.
(A) Tumor growth and survival in B16.gp33-bearing mice after transfer of WT or VHL-KO P14 cells and anti–PD-1(αPD-1) or PBS treatment. Tumor growth was compared by Mann-Whitney U test (middle) and survival was assessed by Bonferroni-corrected log-rank test (right). n = 12 (αPD-1) and n = 8 (isotype) in P14 transferred mice; n = 5 (αPD-1) and n = 3 (isotype) with no transfer. (B) Representative flow cytometry (left) and quantification of frequency (top right) and weight-adjusted numbers (bottom right) of CD69+CD103+ P14 TILs recovered at endpoint in A from mice treated with anti–PD-1 or PBS. n = 8 for WT donor with αPD-1; n = 5 for rest. (C) Specific target cell lysis of sorted donor WT and VHL-KO TILs after treatment with anti–PD-1 or isotype control antibody (bottom left). Ratio of cotransferred donor VHL-KO/WT TILs recovered (top right) and MFI of granzyme-B expression on sorted populations (bottom right) are shown. n = 4 for CTL assay; n = 7 for donor cell ratio; n = 4 for αPD-1; n = 3 for isotype control in granzyme-B panel. (D) Representative flow cytometry of IFN-γ and TNF-α coproduction by donor TIL populations upon restimulation, quantitated by frequency (top right) and compared by ratio of anti–PD-1 to control treatment (bottom right), n = 3 (top right), and n = 4 pooled (bottom right). Data are representative of 2 (A–C) and 4 (D) independent experiments. Error bars represent mean ± SEM. NS, not significant, *P < 0.05, **P < 0.01, ***P < 0.001, ****P < 0.0001 (Student’s t test C top and D bottom panel, 1-way ANOVA with Bonferroni correction for multiple comparisons in others, except as specified in A).

