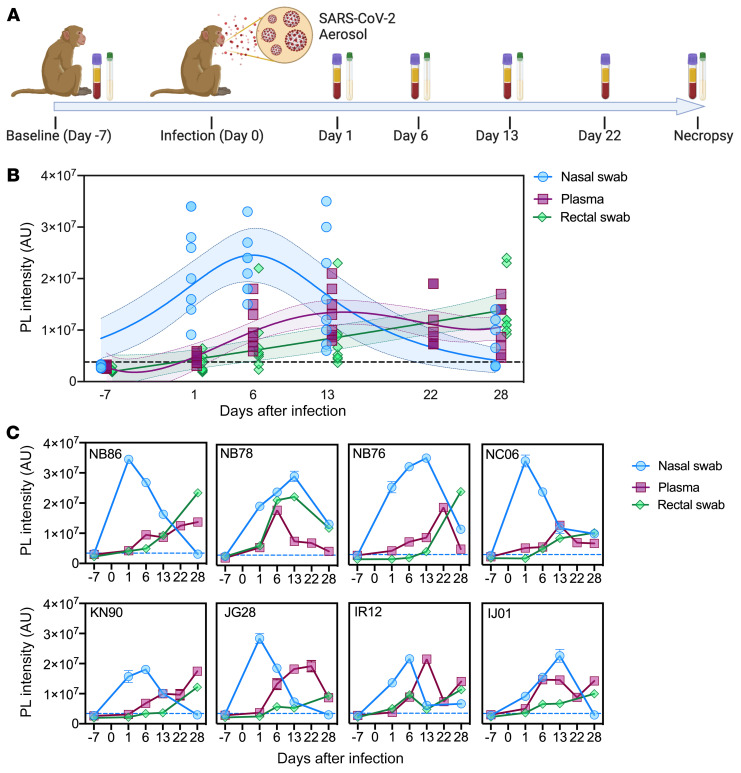
Figure 3. CRISPR-ABC analysis of samples from SARS-CoV-2-infected NHPs.
(A) Sample collection timeline (plasma and nasal and rectal swabs) versus SARS-CoV-2 infection. (B) CRISPR-ABC signal at the indicated sample time points. Shading indicates the 95% confidence interval of the fitted line. (C) CRISPR-ABC signal for samples from individual NHPs at indicated time points. SARS-CoV-2 RNA abundance is expressed as the relative photoluminescence (PL) intensity of the sample, since most samples had values below the LoQ of the CRISPR-ABC assay (Supplemental Data 1). Dotted lines indicate the positive result threshold. Data represent mean ± SD of 3 technical replicates for each sample.

