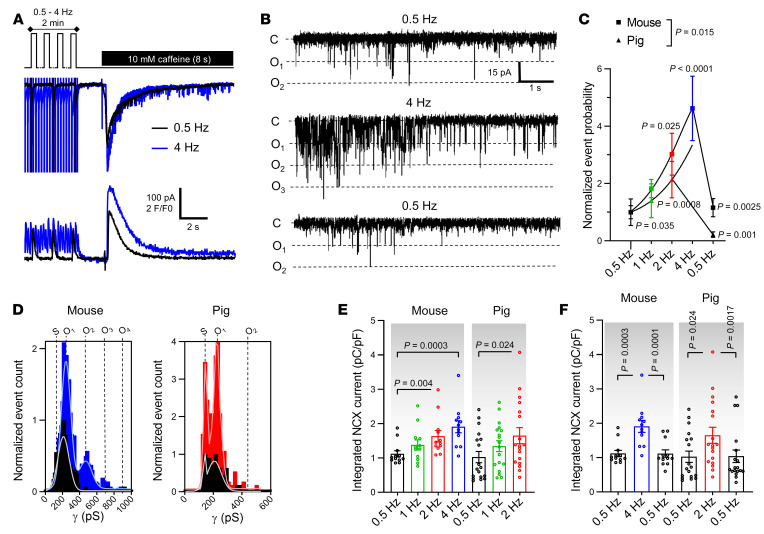
Figure 2. Cx43 hemichannel activation is frequency dependent.
(A) Top trace shows experimental protocol: cells were paced for 2 minutes to steady state (mouse 0.5, 1, 2, or 4 Hz; pig 0.5, 1, or 2 Hz) followed by caffeine superfusion. Middle and bottom traces depict current and [Ca2+]i signals recorded in a mouse myocyte after 0.5 (black) or 4 Hz (blue) pacing. (B) Unitary current example traces after 0.5 and 4 Hz including reversibility (NCX currents subtracted). (C and D) Summary graph and transition histograms indicate significant and reversible increase in unitary current event probability with increasing pacing frequency (N/nmouse = 4/12, N/npig = 7/19). P values compare to 0.5 Hz or to 2/4 Hz (nested 1-way ANOVA). (E) Summary dot plot depicting significant increase in SR Ca2+ content with increasing frequency, as determined by integrating NCX current during caffeine (nested 1-way ANOVA; N/nmouse = 4/12, N/npig = 7/19). (F) Summary dot plot depicting reversible increase in SR Ca2+ content with increasing frequency (nested 1-way ANOVA; N/nmouse = 4/12, N/npig = 7/19).

