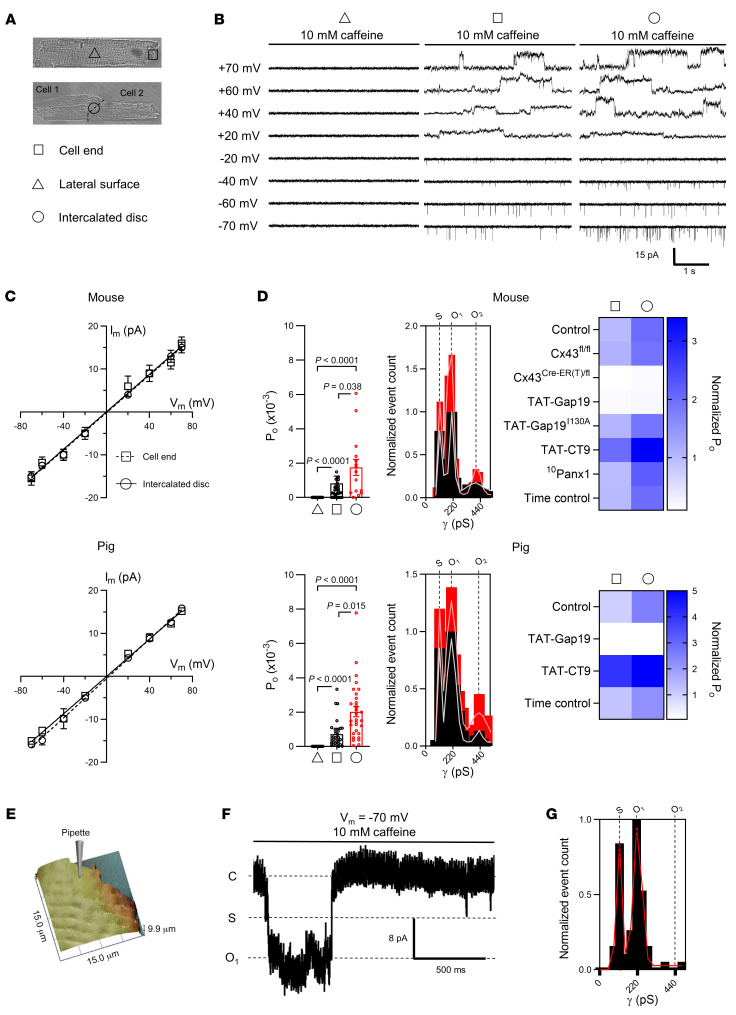
Figure 5. Discrete sites of Cx43 hemichannel activation at the intercalated disc during Ca2+ release from the sarcoplasmic reticulum.
(A) Transmitted light images of a single cardiomyocyte (top) and cardiomyocyte cell pair (bottom). Triangle, square, and circle symbols indicate cell-attached macropatch (Rp = ~2 MΩ, ~2 μm pipette inner diameter) recording positions at the lateral membrane and cell end of single cardiomyocytes and intercalated disc of cardiomyocyte cell pairs, respectively. (B) Example traces showing single channel currents recorded at the lateral membrane, cell end, or intercalated disc. Traces recorded in mouse cardiomyocytes during caffeine superfusion (10 mM, 8 seconds) at indicated membrane potentials. (C) IV plots depicting linear current-voltage relationship with slope conductance of approximately 220 pS and Erev ≈ 0 mV (N/nmouse = 5/10–18 patches per condition, N/npig = 5/15–20 patches per condition). (D) Summary dot plots and transition histograms indicate recording of approximately 220 pS single channel currents at the cell end of single cardiomyocytes, but not at the lateral membrane, with significantly increased open probability at the intercalated disc of cardiomyocyte cell pairs. Comparative statistics with nested 1-way ANOVA. Heatmap summarizes single channel open probability at the cell end or at the intercalated disc under conditions of Cx43 knockdown or in the presence of TAT-Gap19, inactive TAT-Gap19I130A, TAT-CT9, or 10Panx1 (N/nmouse = 5/10–18 patches per condition, N/npig = 5/15–20 patches per condition). (E) SICM-generated membrane topology of the cell end of a mouse left ventricular cardiomyocyte. Pipette indicates the recording position distally of the last Z-line. (F) Example trace recorded at –70 mV during caffeine superfusion. (G) Transition histogram from all experiments (n = 5, n = 35) showing a fully open state at approximately 220 pS and a substate at approximately 110 pS.

