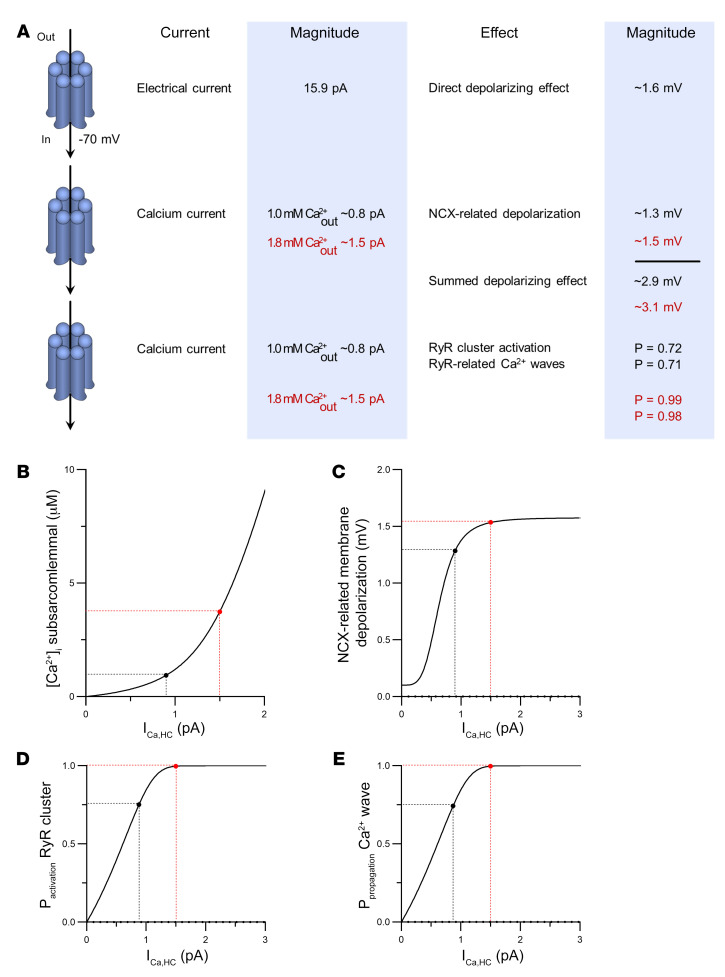
Figure 9. Modeling-based estimations of electrical and Ca2+ consequences of single hemichannel opening.
(A) Schematic overview of electrical and Ca2+ consequences of single hemichannel opening. The 15.9 pA electrical current is a measured value; the 0.8 pA and 1.5 pA Ca2+ currents are calculated estimates using 1.0 and 1.8 mM of extracellular Ca2+, respectively. Panels B to E further explore the impact of a range of hemichannel Ca2+ currents. Note that the values given are only valid at –70 mV membrane potential and 37°C. Further modeling details can be found in the supplemental material. (B) Peak elevation of subsarcolemmal [Ca2+]i as a function of single hemichannel Ca2+ current (ICa,HC). (C) Membrane depolarization due to Ca2+ entry is associated with NCX activation. Black and red points indicate hemichannel Ca2+ current estimates, which are close to or in the plateau phase of the curve. (D) Probability of activation of RyR superclusters as a function of single hemichannel Ca2+ current. (E) Probability of Ca2+ wave propagation as a function of single hemichannel Ca2+ current.

