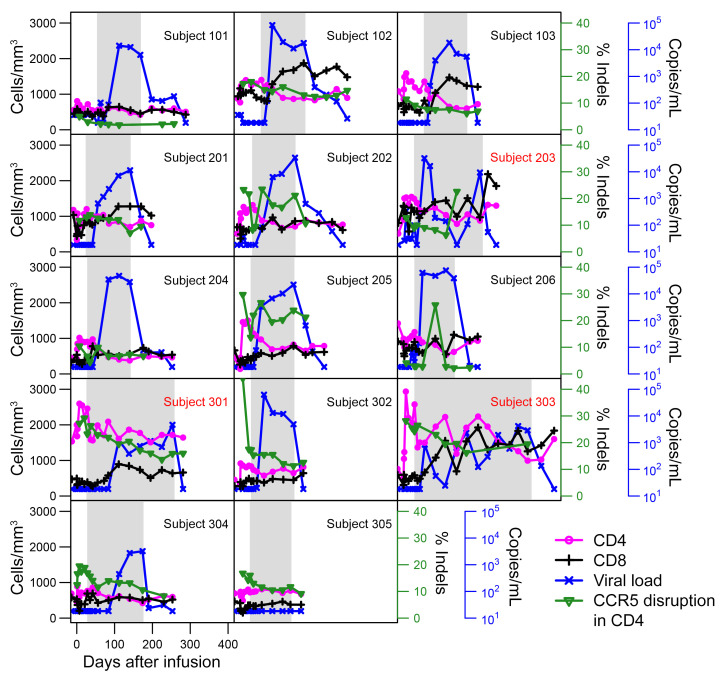
Figure 3. Analysis of CD4+ and CD8+ T cell counts, viral load, and percentage of CCR5 disruption within peripheral CD4+ T cells.
At the indicated time points, CD4+ and CD8+ T cell counts as well as viral load were measured. The percentage of CCR5 disruption was calculated as described in Methods. Individuals who participated in an extended ATI are indicated with a red subject ID.

