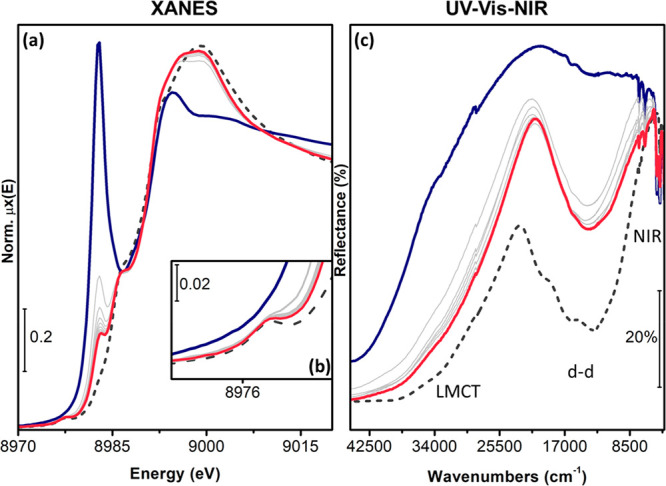
Figure 2.

Evolution of the Cu K-edge XANES (a) and DR UV-Vis-NIR spectra (c) of Cu-CHA during exposure to 10% O2/He at 200 °C after reduction in NO/NH3/He at 200 °C. Inset (b) reports a magnification of the pre-edge peak arising from the CuII 1s →3d transition. Dark blue thick line: after NO/NH3/He exposure; red thick line: final spectrum after exposure to 10% O2; gray thin lines: intermediates; dark gray dashed line: Cu-CHA pretreated in O2, by heating in O2 up to 400 °C and subsequently cooling in O2 down to 200 °C prior to XAS data collection, step 1.
