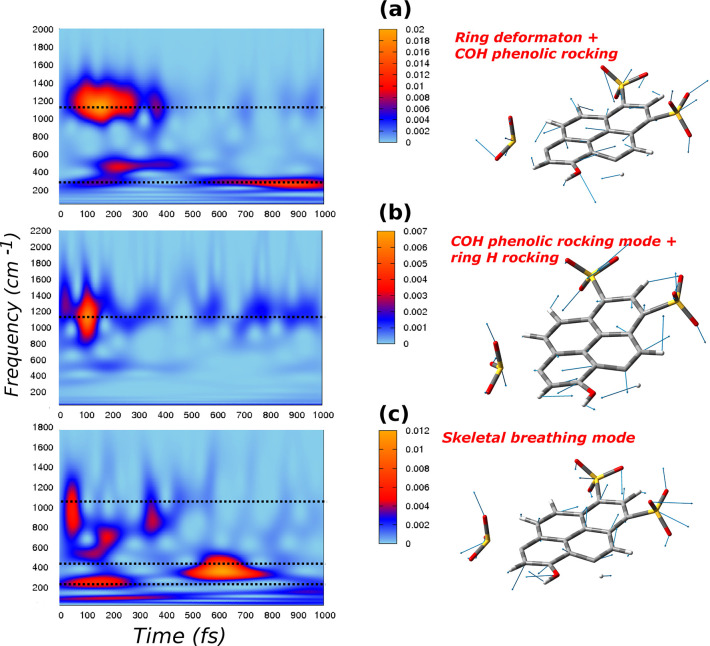
Figure 3.
Q modes (right panels) and corresponding 2D wavelet power spectra (left panels). The color scale states for the intensity are in arbitrary units: a) ring deformation modes associated with a strong −COH phenolic rocking, with an AIMD frequency of 320 cm–1, an exp. value of 321 cm–1, and an exp. rise time of 680 fs; b) COH phenolic rocking combined with the rocking motion of the nearby ring hydrogen, with an AIMD frequency of 1156 cm–1 and an exp. value of 1154 cm–1; and c) a skeletal breathing mode, with an AIMD frequency of 190 cm–1, an exp. value of 191 cm–1, and an exp. decay time of 540 fs.

