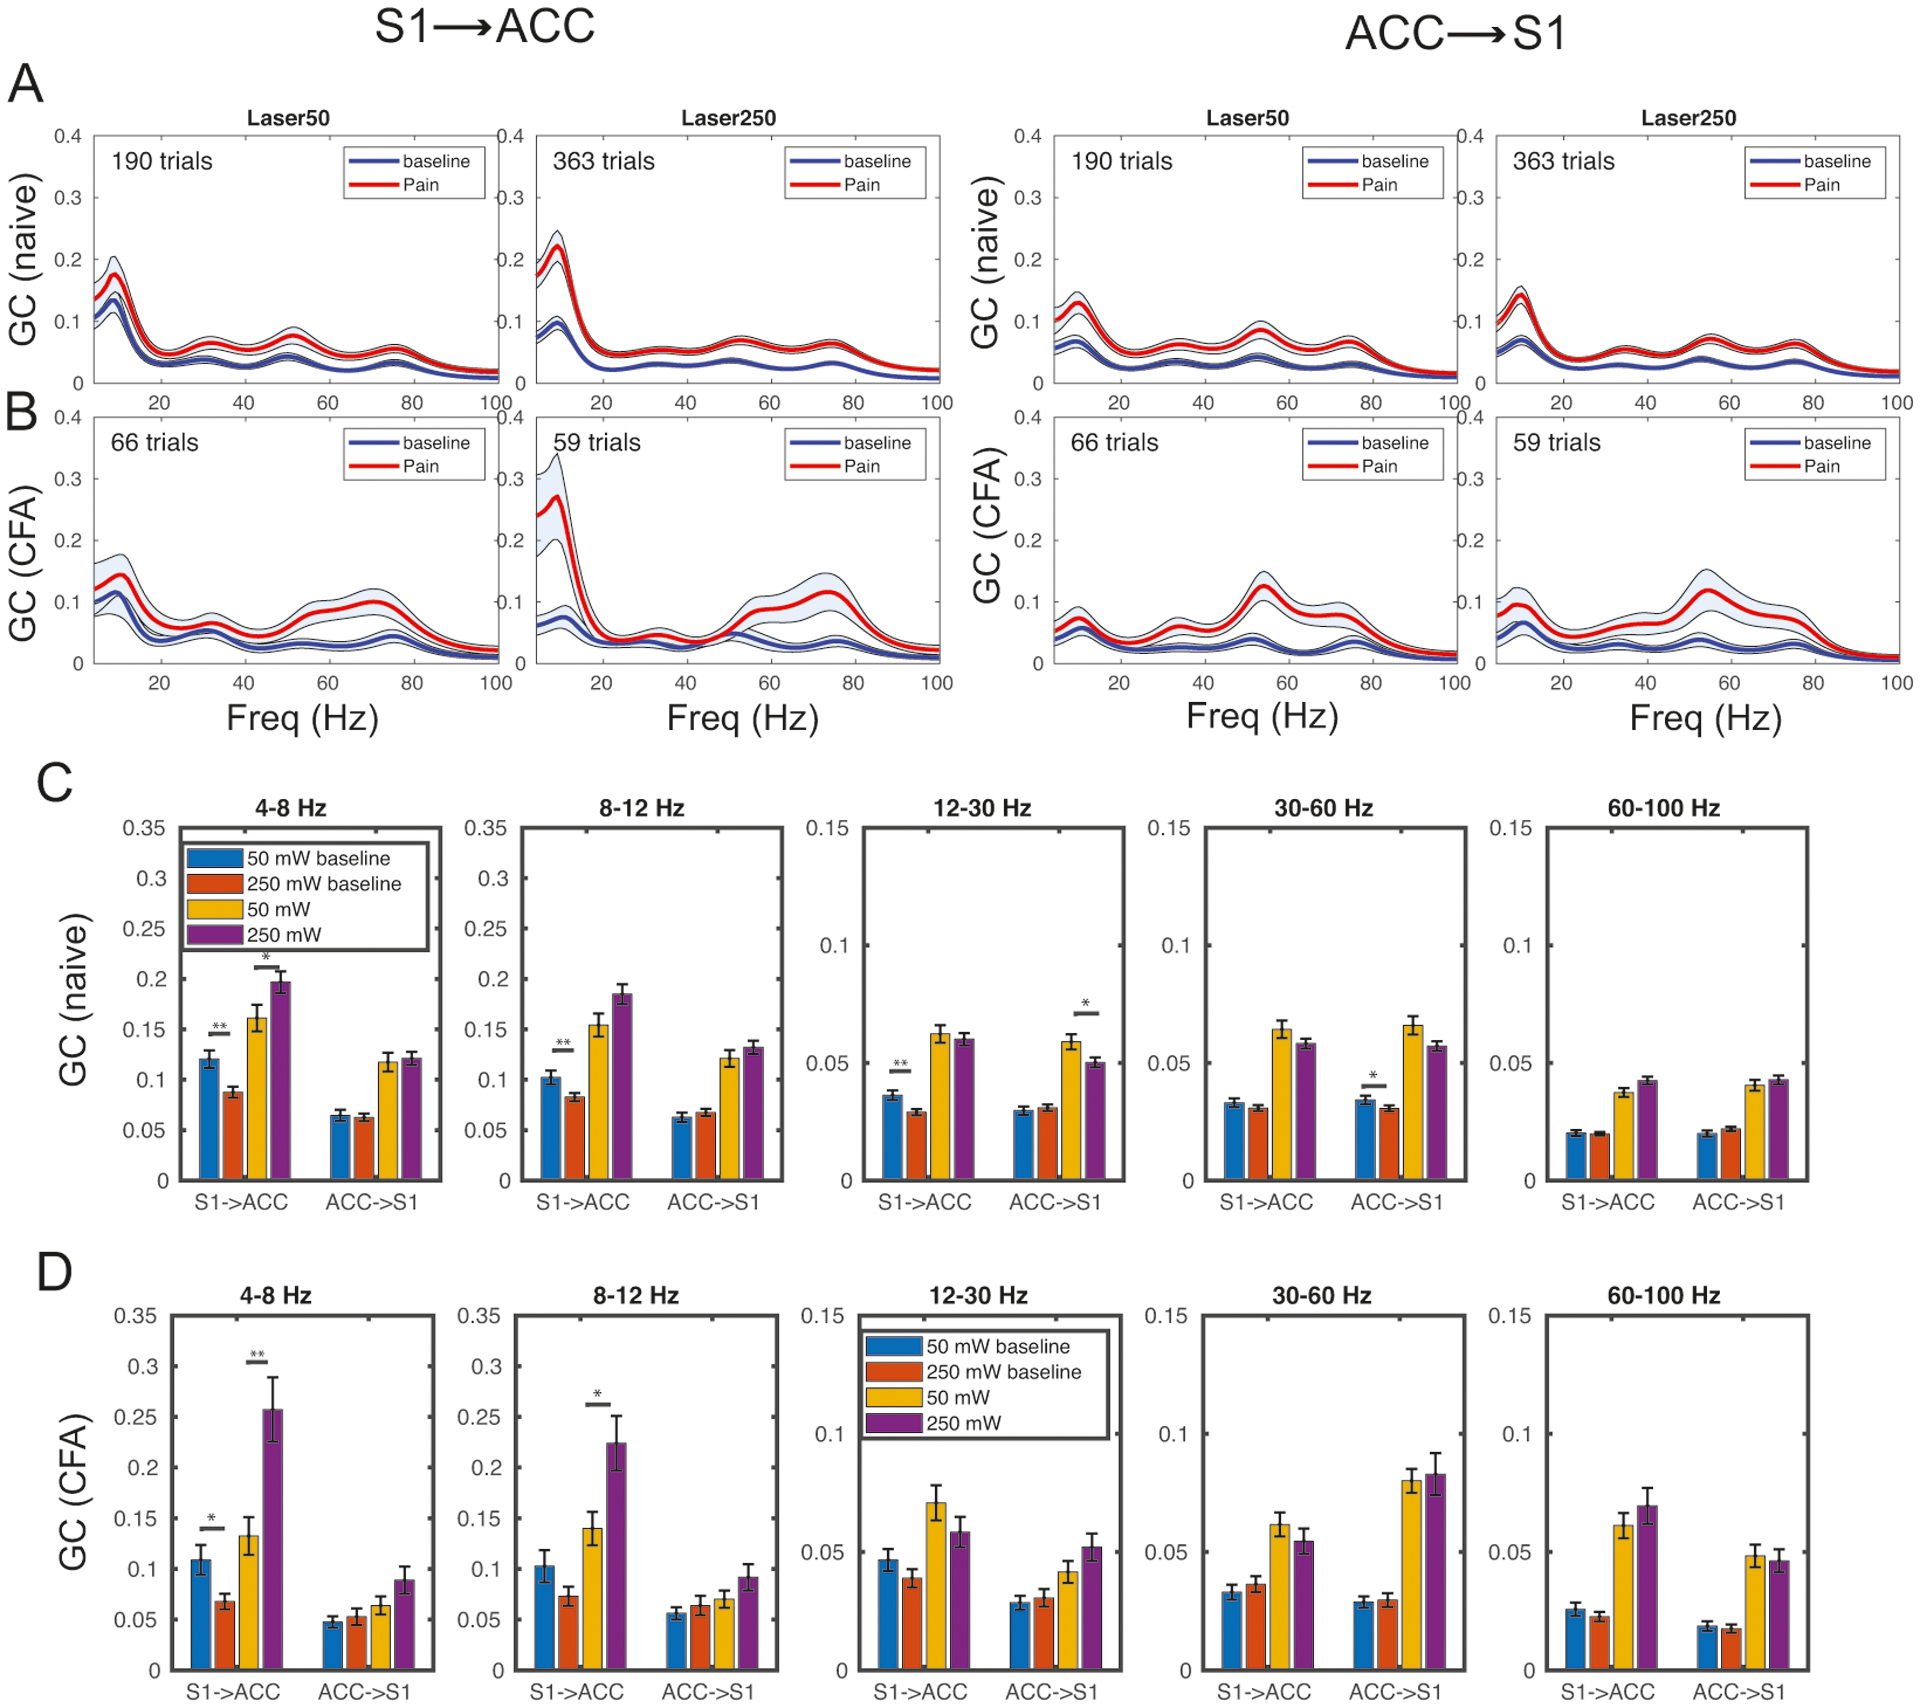
Figure 4:

Granger causality (GC) analysis during thermal stimuli (250 mW vs. 50 mW laser) stimulations in naive and CFA rats. (A) Spectral GC estimates in both S1→ACC and ACC→S1 directions. Shaded areas denote the 95% confidence intervals. (B) Similar to panel A, except for CFA rats. (C,D) Population statistics of GC measures at different frequency bands. Rank-sum test: *, p < 0.05; **, p < 0.01.
