
FIG. 2.
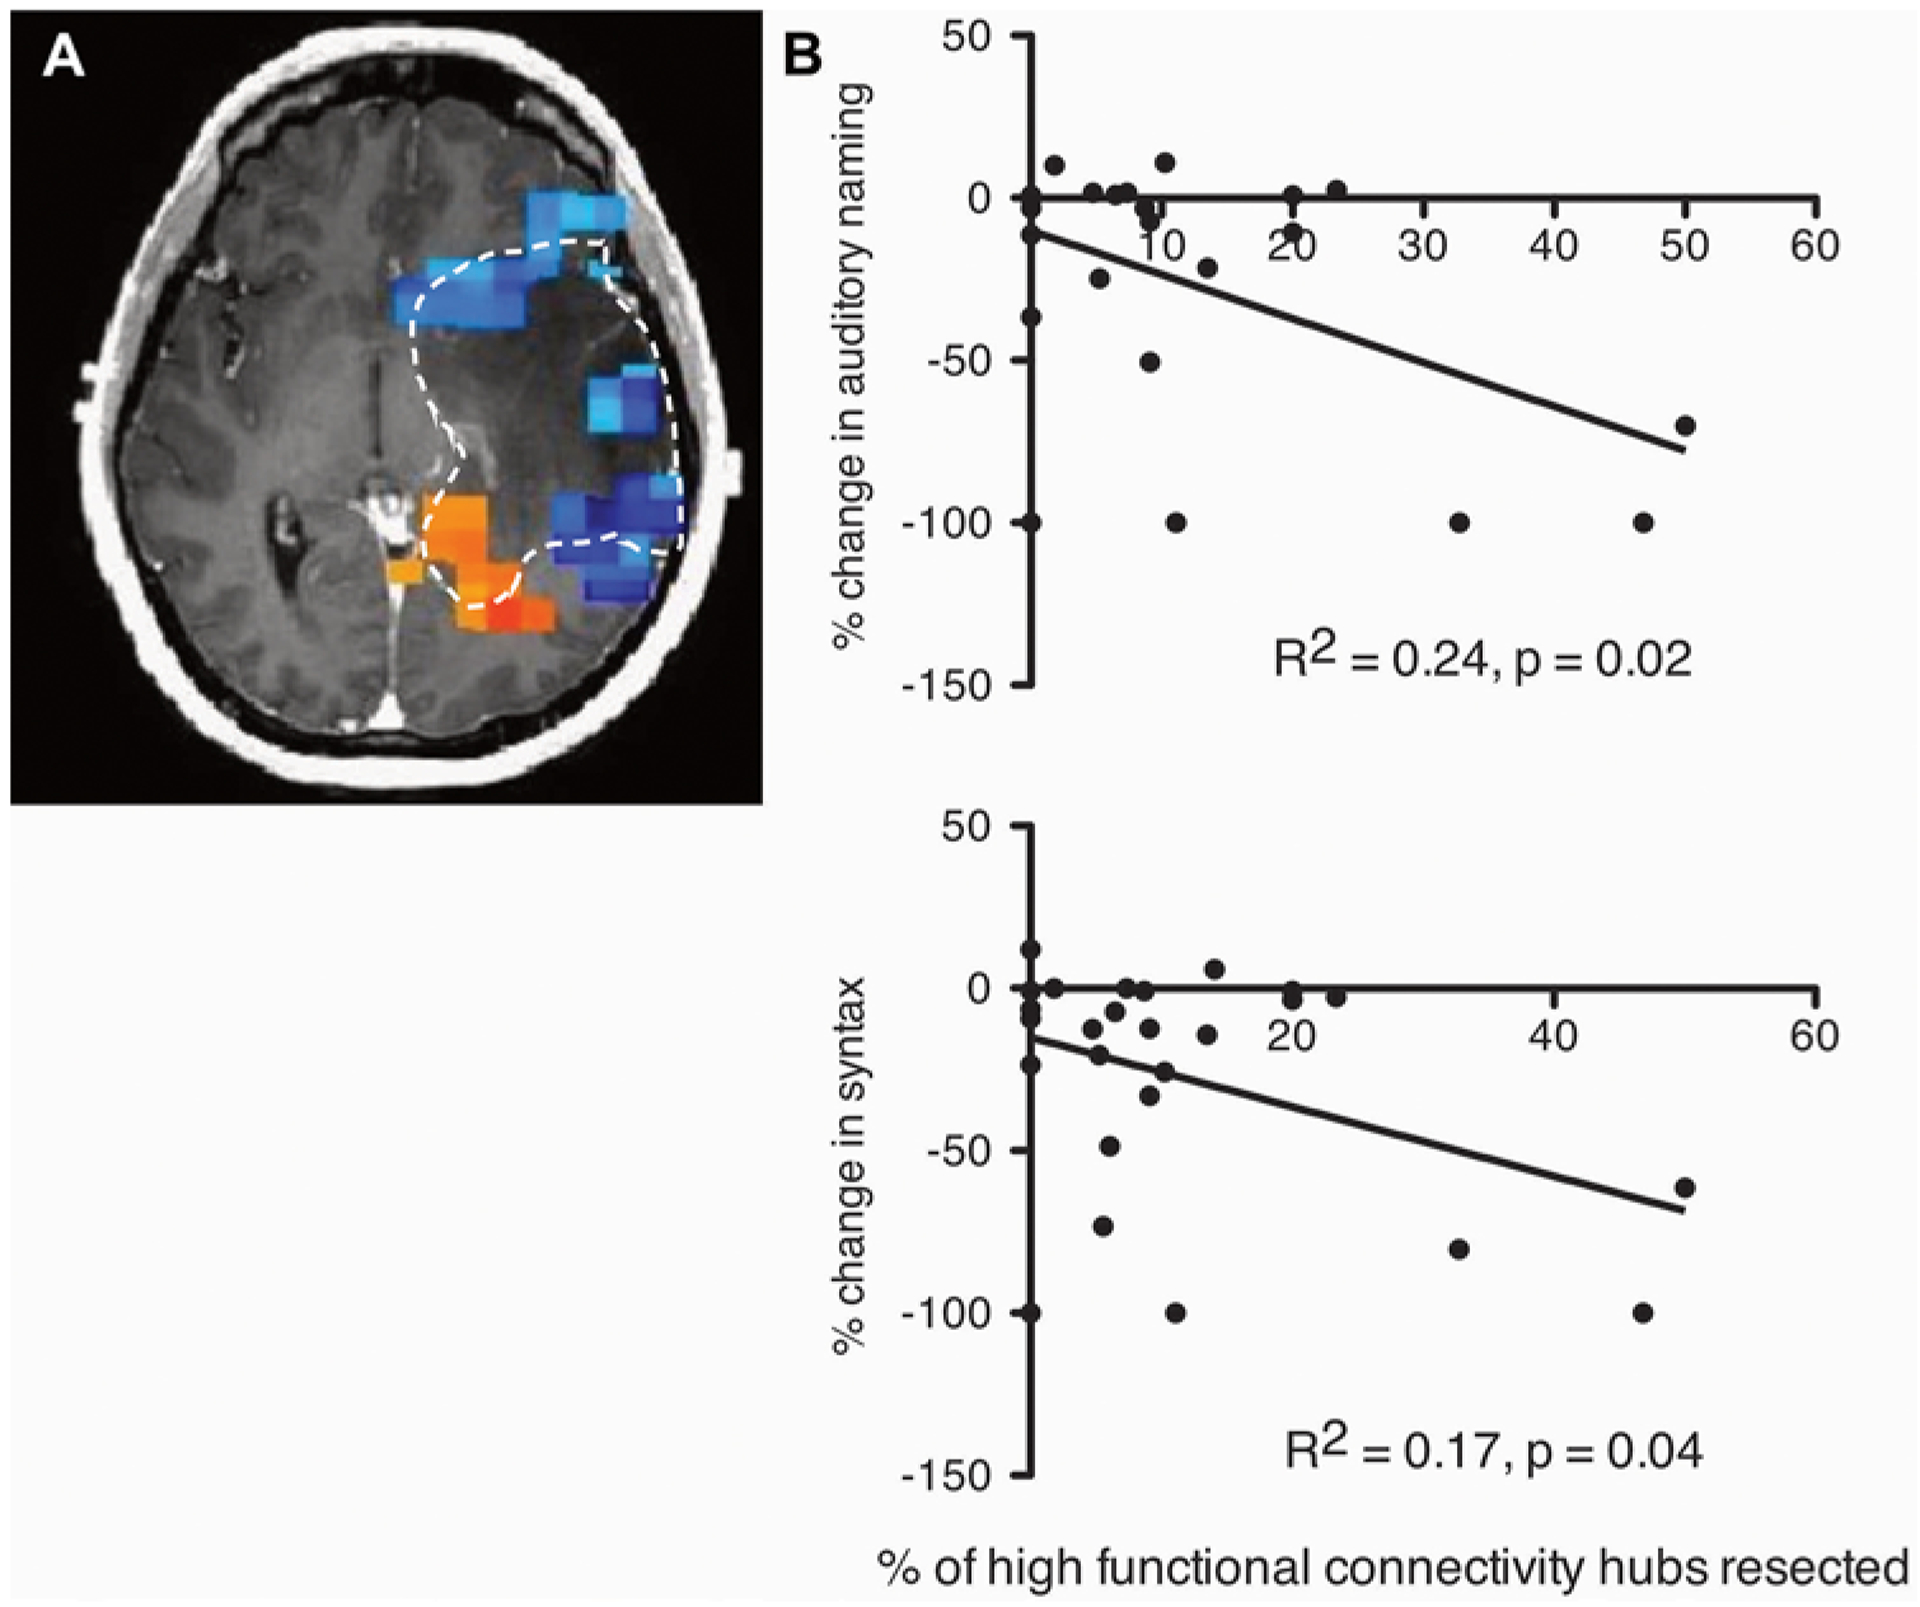
Resection HFC hubs correlates with worse outcomes in AN and SYN. A: Illustrative example of voxels with increased functional connectivity (red and orange) and suppressed functional connectivity (blue and green). Hashed line indicates the tumor outline. B: A patient’s pre- and postoperative change in a specific language task (AN [upper]; SYN [lower]) was compared to the percentage of HFC hubs that were resected (AN: R2 = 0.24, p = 0.02; SYN: R2 = 0.17, p = 0.04). Patients underwent preoperative MEG to identify resting-state HFC hubs, and resection was guided by intraoperative awake language mapping. Each dot represents a patient.