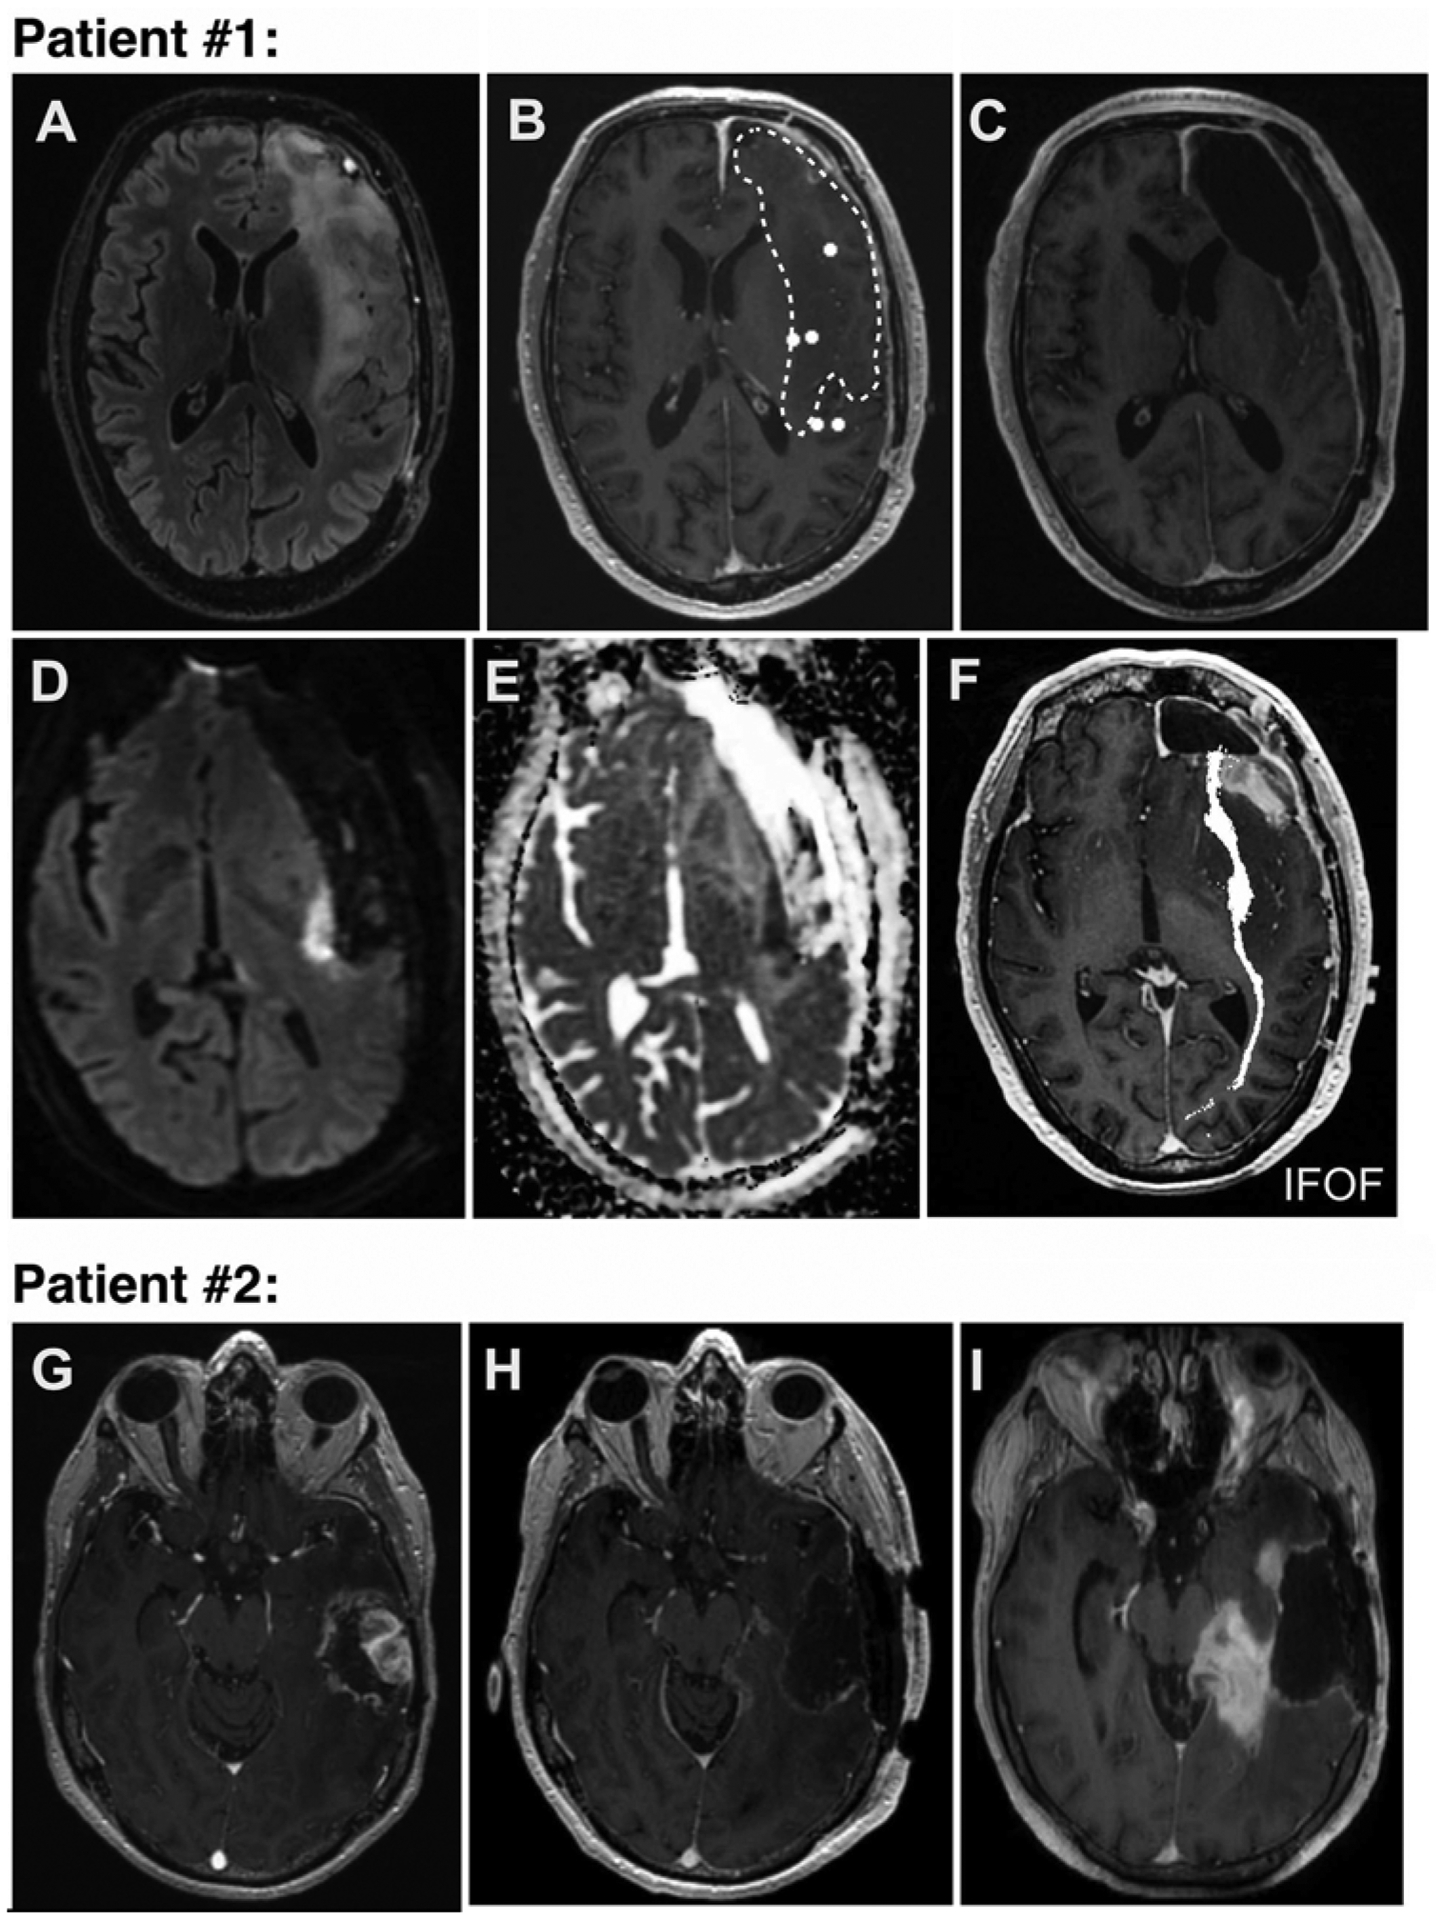
FIG. 4.

Patients in whom AN and SYN function had failed to recover by their late postoperative follow-up visit. Upper: Patient 1 had not recovered to baseline AN and SYN task performance at late follow-up. A: Preoperative T2-weighted FLAIR MR image showing a frontal-temporal-insular tumor. B: Resting-state MEG image overlaid onto T1-weighted Gd-enhanced MR image with white dots representing HFC nodes. Hashed lines denote tumor margin. C: Postoperative T1-weighted Gd-enhanced MR image showing the resection cavity. D–F: Postoperative DWI and ADC (apparent diffusion coefficient) images revealing a focal area of stroke directly in the inferior frontooccipital fasciculus (IFOF). Lower: Patient 2 had worsened performance in all language tasks at late follow-up. G: Preoperative T1-weighted Gd-enhanced MR image showing a temporal tumor. H: Postoperative image of the resection cavity. I: One-month follow-up image showing new contrast enhancement consistent with tumor progression.
