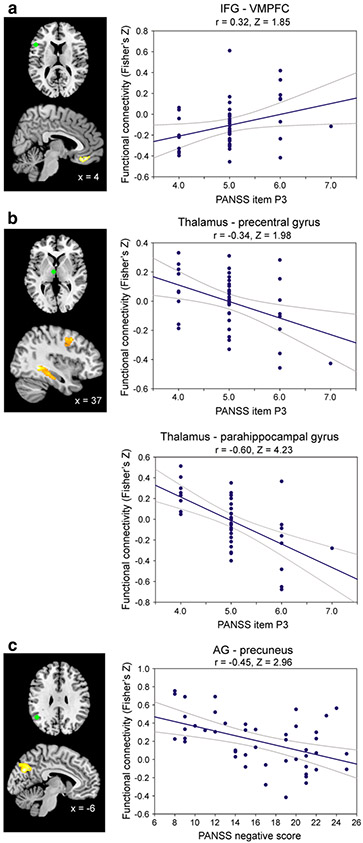
Fig. 4.
Correlations with PANSS-scores. Connectivity between the seeds (green) and brain regions showing a significant relationship with hallucination severity (a, b) and with negative symptoms (c) as measured by the PANSS. All images are thresholded at p < 0.05 (FWE-corrected at cluster-level; cluster forming threshold at voxel level: p < 0.001)

