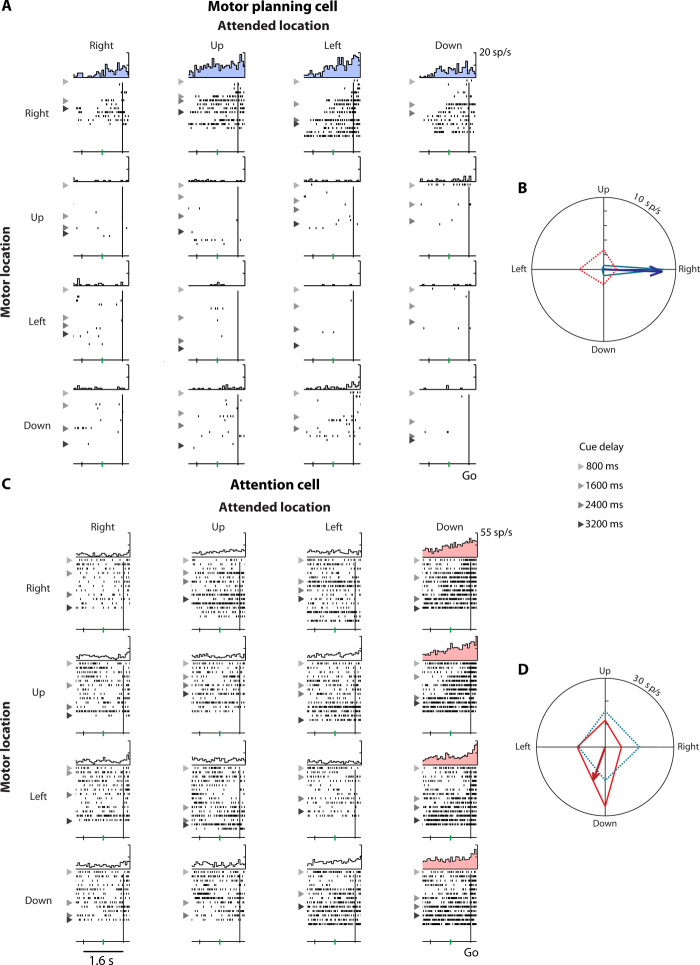
Fig. 4. Example motor planning cell and attention cell.
Single-unit activity on correct cued trials was arranged by motor location (rows) and attended location (columns) in a 4 × 4 matrix (see Fig. 1B). PETHs and raster plots show spiking activity, aligned to the go signal. Rasters are sorted by the cue delay, with triangles separating trials with progressively longer durations. (A) A motor planning cell (main effect of motor location only, P < 0.001) that preferentially responded to the right motor location (blue histograms). (B) The blue polar tuning curve depicts this cell’s mean firing rate for each motor location (row-wise average of the 4 × 4 matrix). The vector sum of these rates (blue arrow) is the cell’s motor planning PD. Firing rates were computed in the 800 ms before the go signal (from the green tick mark to the vertical line). The red tuning curve shows the cell’s activity for each attended location (column-wise average of the 4 × 4 matrix). The dashed line and absence of a red arrow signify that activity was not significantly modulated by the attended location. (C) An attention cell (main effect of attended location only, P < 0.001) that responded more when the monkey attended the down location (pink histograms). (D) The red polar tuning curve shows this cell’s mean firing rate for each attended location. The vector sum of these rates (red arrow) is the cell’s attention PD. Activity was not significantly modulated by the motor location (dashed blue line), so the motor planning PD is not shown. These example neurons from monkey G’s PF had long latencies. Consequently, the response to cue onset just preceded the go signal on trials with an 800-ms cue delay (lightest triangles).

