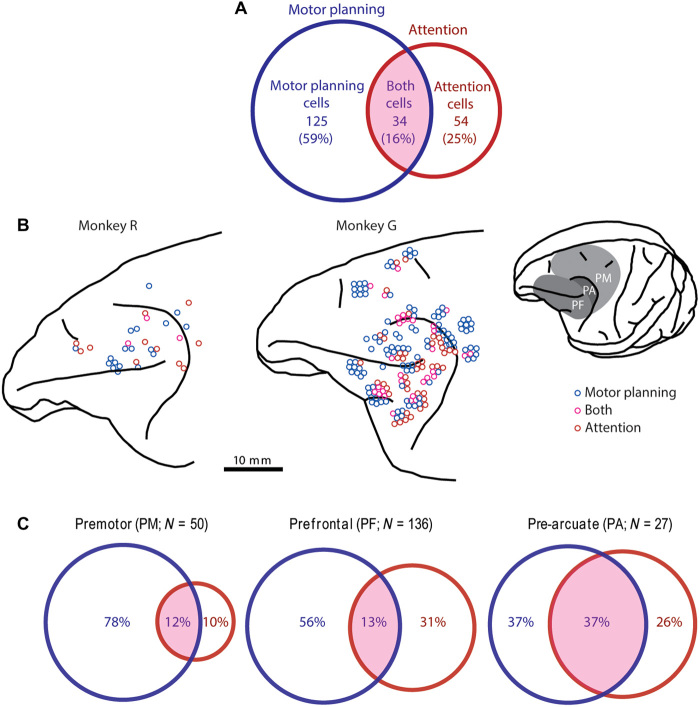
Fig. 5. Classification and distribution of tuned neurons.
(A) Venn diagram showing the number of tuned neurons (N = 213) significantly (P < 0.05; two-way ANOVA, main effects) modulated by the motor location (blue circle) and the attended location (red circle). The overlapping area, labeled “both cells,” represents cells that encode both attention and the motor plan. (B) Lateral views of the left frontal cortex of each monkey. Circles show the point of electrode insertion, jittered for clarity, in which motor planning cells (blue), attention cells (red), and both cells (magenta) were recorded. Inset shows the surface view of monkey G’s left hemisphere with delineation of the PM, PF, and the cortex just anterior to the arcuate sulcus (PA). Cells were localized to an area by histological analysis, which was not necessarily the same as the depicted point of insertion. (C) Distribution of cell types by brain area. Venn diagrams show the tuning of neurons in the PM, PF, and PA. Both cells were uncommon in the PM and PF (<13%) but accounted for 37% of the tuned neurons in the PA, where attention tuning was most common.

