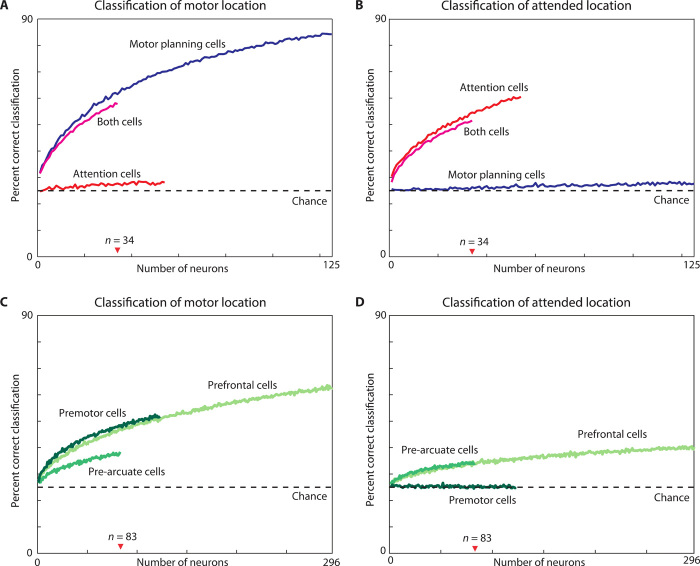
Fig. 6. Decoding the motor and attended locations in different cell types.
The neuron-dropping curves show the percentage of correct single-trial classifications of the motor target location (A and C) and the attended location (B and D) as a function of the number of neurons contributing to the classification. Classification was based on single-trial firing rates computed over the 800 ms before the go signal. (A and B) Classification by motor planning (blue), attention (red), and both cells (magenta) was above chance (dashed line at 25% correct) for even a single neuron tuned to the relevant location and increased as the number of neurons increased. In contrast, even large ensembles of neurons tuned for one location, decoded the other location at close to chance level (e.g., decoding of attended location by motor planning cells). (C and D) Classification performance of ensembles of tuned and untuned cells in the three brain areas. The performance of different cell types should be compared for a given number of neurons. Note that the x axis differs in the top and bottom. SDs for each curve were calculated using ensembles of 34 cells (top) or 83 cells (bottom), corresponding to the smallest cell group in each panel, but were too small (<0.5%) to be plotted. As a result of this low variance, all pairwise differences at N = 34 and N = 83 were significant (P < 0.0001, t test, N = 17 repeats).

