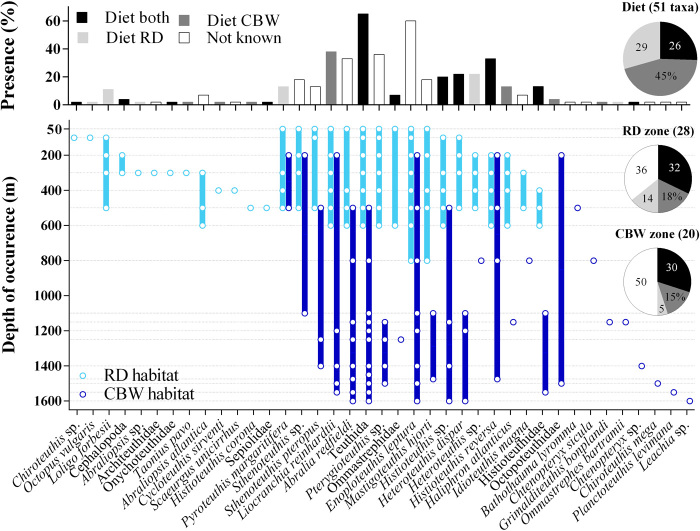
Fig. 5. Cephalopod species community and depth distribution from eDNA reveal cetacean deep-sea prey spectra.
(Top) Frequency of presence (percentage of sampling records) of the 39 cephalopod taxa identified from eDNA. The color indicates occurrence in the diet of both predators (black), one of the predators (dark/light gray), or not reported in the diet (white; table S5). (Bottom) Cephalopod taxon detection depth and range of occurrence (open circles, filled bar) in Risso’s dolphin (G. griseus, RD; light blue) and Cuvier’s beaked whale (Z. cavirostris, CBW; dark blue) habitat, with respective bottom depths of ~800 and ~1600 m. Dotted lines represent sampling depths (Risso’s dolphin habitat, 50 to 800 m; Cuvier’s beaked whale habitat, 200, 500, 800, and 1100 to 1600 m). Pie graphs show the percentage of cephalopod species reported in the diet of both predators, that are prey of both or either predator (top) and the percentage of taxa recorded in the foraging zones that are prey for both or either predator. Numbers indicate percentage of total taxa.

