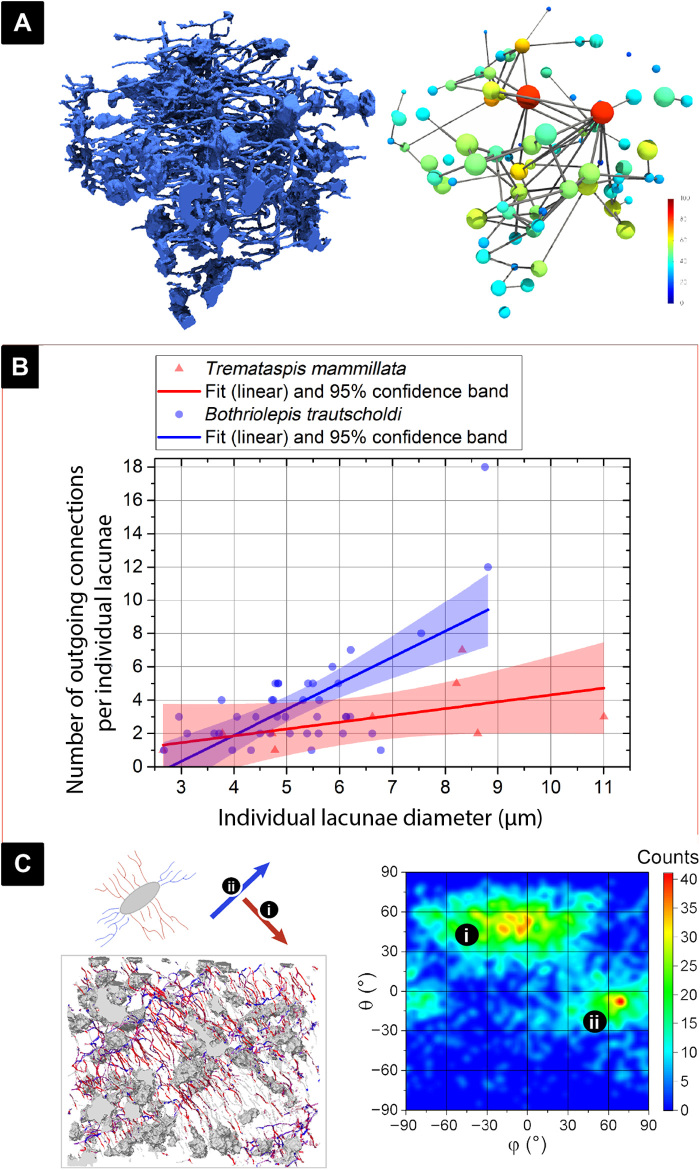
Fig. 5. Analysis of osteocyte lacunae size in relation to canalicular number and direction.
(A) The 3D cell spaces and canaliculi of the B. trautscholdi (MB.f.9188a) sample were reduced to skeletal forms (see data analysis in Materials and Methods) to visually illustrate that larger cell lacunae (in warmer colors) have more canaliculi connections. (B) Relationship between cell lacunae size and number of outgoing canaliculi in both tested samples, B. trautscholdi (MB.f.9188a) and T. mammillata (MB.f.9025), showing that the larger the cell, the more outgoing canaliculi emanate from it (related analysis parameters are shown in table S2A). (C) Directionality analysis on the B. trautscholdi (MB.f.9188a) specimen shows that there are two predominant directions where canaliculi emanate from the osteocyte lacunae, and that these two directions are almost perpendicular to one another as shown in the heatmap.

