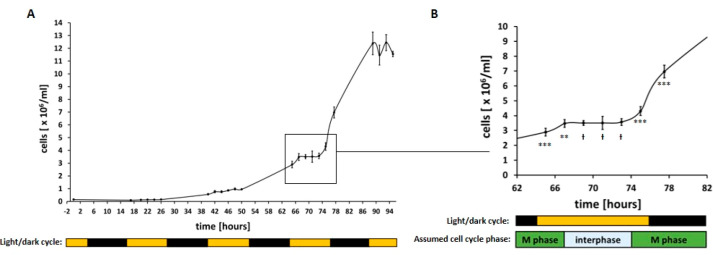
Figure 2.
Growth curves of synchronized C. r. CW15 cultures. The number of cells of C. r. CW15 grown at 28 °C during the light phase (12 h, 200 μmol photons m–2 s–1) and at 18 °C (12 h) during the dark phase (as indicated by bars) was determined using a cell counter after 2 weeks of preculturing under the same conditions. Each data point represents an average of three technical replicates that were each counted twice. (A) Overview of cell number during growth for 4 days. (B) Enlarged view of the curve after 3 days of growth. Assumed cell cycle phases are shown as bars. A one-sided t test was performed, and the statistical confidence level is shown in relation to the previous data point as two asterisks for p < 0.01, three asterisks for p < 0.001, while a hash represents insignificant values of p > 0.05.

