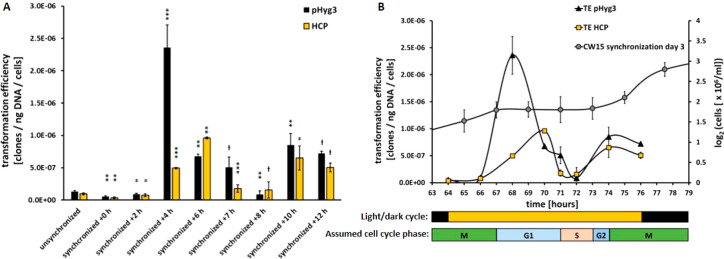
Figure 4.
Analysis of transformation efficiency of unsynchronized and synchronized cell cultures of C. r. CW15. (A) TE was measured at different time points (h, hours after illumination start) after 3 days of cultivation under synchronizing conditions. Each data point shows mean ± SD, n = 3. Transformations by linearized construct pHyg3 (nonhomologous) are depicted in black, and those by linearized construct HCP (homologue to cpftsy) are shown in yellow. A one-sided t test was performed and the statistical confidence level is shown in relation to the previous related data point as one asterisk for p < 0.05, two asterisks for p < 0.01, three asterisks for p < 0.001, while a hash represents insignificant values of p > 0.05. (B) TE data is displayed in comparison with the corresponding cell number (shown as log2, gray circles) on the third day of growth under synchronizing conditions (compare Figure 2B). Below, the illumination cycle is depicted as bars, as well as the assumed cell cycle phases.

