Figure 5.
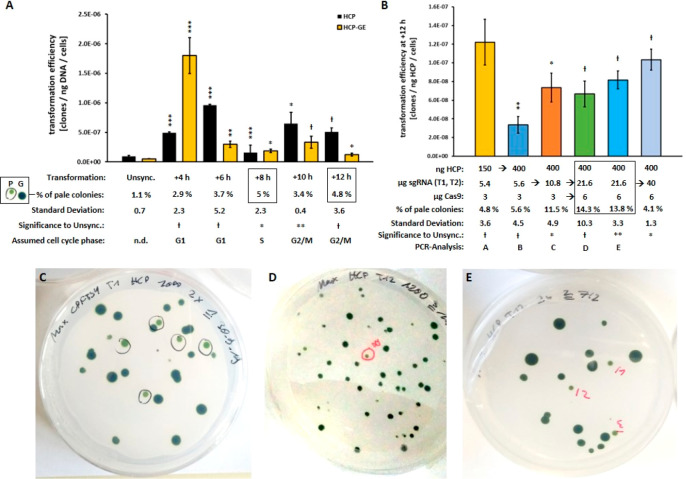
Transformation efficiency of unsynchronized and synchronized cell cultures of C. r. CW15: Effect of ribonucleoprotein Cas9 on the transformation efficiency. (A) TE were determined for unsynchronized (unsync.) and synchronized cell cultures of C. r. CW15, using the linearized cpftsy homologous HCP construct only (black bars) or together with ribonucleoproteins (yellow bars, HCP-GE containing Cas9, sgRNAs T1 and T2) at different time points after the start of illumination. Data is shown as mean ± SD, n = 3. Below, the determined percentage of the total pale green colonies obtained for HCP-GE (P, of green colonies G) is given: maximal values are surrounded by black boxes. A one-sided t test was performed, and the statistical confidence level is shown in relation to the data of unsynchronized cells (unsync.) as one asterisk for p < 0.05, two asterisks for p < 0.01, three asterisks for p < 0.001, with a hash representing insignificant values of p > 0.05. This was calculated in the same way as (B). Assumed cell cycle phases are also shown below. (B) Transformation efficiencies of further variations of HCP-GE trials at time point +12 h are shown as mean ± SD, n = 3. The amounts used of HCP, sgRNAs T1, T2, and Cas9, as well as the percentage of pale colonies and the numbers for PCR analysis, are given below. The determined optimal ratio of components is marked by a black box. Representative pictures of transformation results, i.e., pale mutants (marked black and red) vs normal green mutants are shown as a general example in (C), of transformation using HCP at +4 h (D, compare A), as well as of transformation D at +12 h (E, compare B).

