Figure 6.
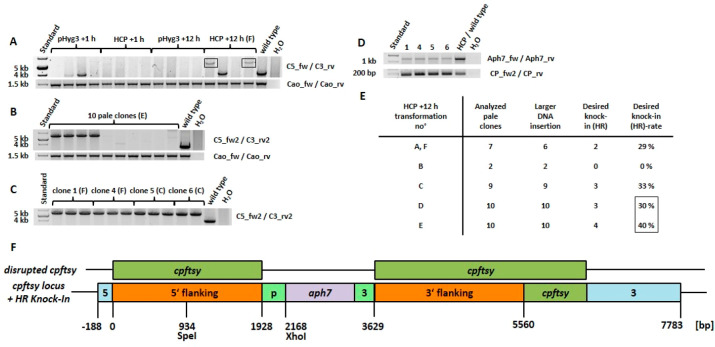
Target sequence analysis of selected pale mutants of C. r. CW15 from different transformation approaches. (A) PCR analysis carried out by the flanking region surrounding primers (C5_fw/C3_rv) for locus cpftsy. Four pale mutants for each construct (pHyg3, HCP) at two different time points (+1 h, + 12 h) were analyzed together with the wild type; the amplicons expected after HR-mediated knock-in of about 5.8 kb are surrounded by black boxes. (B) Similar PCR analysis were carried out with optimized primers (C5_fw2, C3_rv2) for 10 pale clones from transformation E (see Figure 5B). As positive controls for each cell line, additional PCRs were performed using primers Cao_fw and Cao_rv and are shown in the lower part of the A–B panels. (C) Selected pale mutants from transformations C, F at +12 h (see Figure 5B) were used for the amplification of sufficient amounts of recombinant knock-in fragments of cpftsy for purification and further analysis, as shown in (D), that is, Nested-PCRs were performed using the purified fragments as template and primers Aph7_fw/Aph7_rv for detection of the inserted aph7 gene, in addition to primers CP_fw2/Cp_rv for detection of the target sequence T2 of cpftsy as a control. (E) Summary of results of additional PCR analysis performed on pale clones from corresponding transformations of C. r. CW15 at +12 h after the start of illumination (see also Figure 5B), showing the numbers of analyzed pale clones, the larger DNA insertions in cpftsy detected, the desired HR-mediated knock-ins (flanking-based target sequence replacement) and its occurrence rate. (F) Schematic representation of knock-ins of the aph7 cassette into cpftsy detected, based on HR-mediated recombination, which was confirmed by sequencing the corresponding XhoI and SpeI restricted amplicons (cloned into bluescript vector KS-) from clones 1F and 4F (see Figure S2). The disrupted genomic sequence of cpftsy is depicted at the top, showing the occurrence of the gene disruption that leads to the pale phenotype. For the numbering, compare with Figure 5B, except for transformation F, which is not shown in detail.

