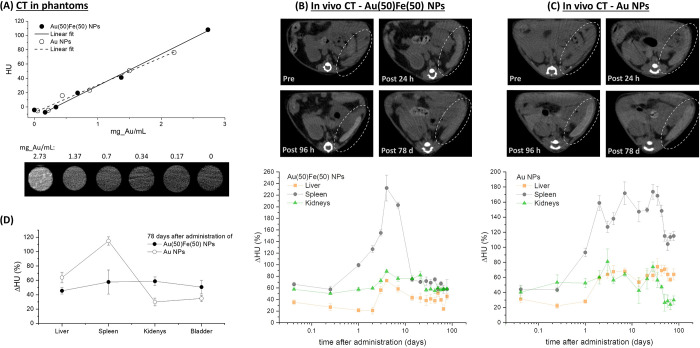
Figure 4.
CT monitoring of the biodistribution. (A) Plot of HU versus Au concentration collected on phantoms containing the Au(50)Fe(50) NPs at variable dilution. CT images of phantoms’ cross-section are also reported. (B, C) Comparative biodistribution study of Au(50)Fe(50) and pure Au NPs administered on healthy mice and monitored by CT up to 78 days. Top: Images of mouse spleen showing the evolution of contrast over time, where it is appreciable that Au(50)Fe(50) NPs massively leave the spleen after 78 days, while Au NPs persisted to a large extent. Bottom: Plot of the relative increment of CT contrast over time, measured as ΔHU (%), in the liver, spleen, and kidneys. The biodistribution curve of Au(50)Fe(50) NPs exhibits a peak, while the curve of Au NPs shows a step, except for kidneys, which are not affected by Au distribution after 60 days. (D) Plot of ΔHU for liver, spleen, kidneys, and bladder at 78 days after administration, suggesting the flow of Au(50)Fe(50) NPs through the renal clearance pathway, in contrast to the persistence of Au NPs in the liver and spleen.

