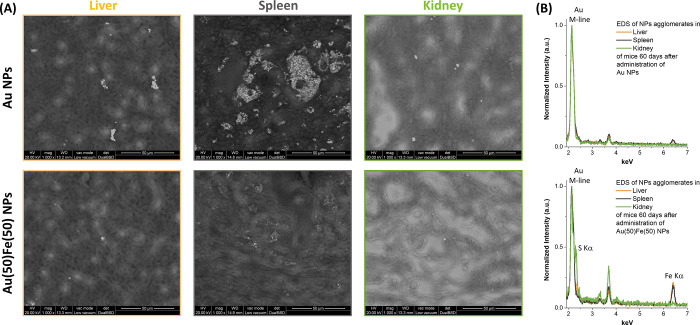
Figure 6.
ESEM analysis of histopathological sections after 60 days. (A) Top: Mice treated with Au NPs. Large agglomerates of NPs are found in the spleen, and several clusters of NPs are found also in the liver and kidneys. Bottom: Mice treated with Au(50)Fe(50) NPs. Compared to the mouse treated with pure Au NPs, in this case there is a much lower density of NPs in all three organs. (B) EDS spectra collected on a group of NPs in each of the histopathological sections. The Au M-line peak is observed in all spectra, while the Fe Kα-line is found only in the liver and spleen of the mouse treated with the Au(50)Fe(50) NPs. In the kidney of the same animal, no Fe peak is detected, but the S Kα-line appears, suggesting that Au-rich nanoparticles coated with thiolated molecules reached this organ. Peaks in the 3–4 keV range belong to Ca and K.

