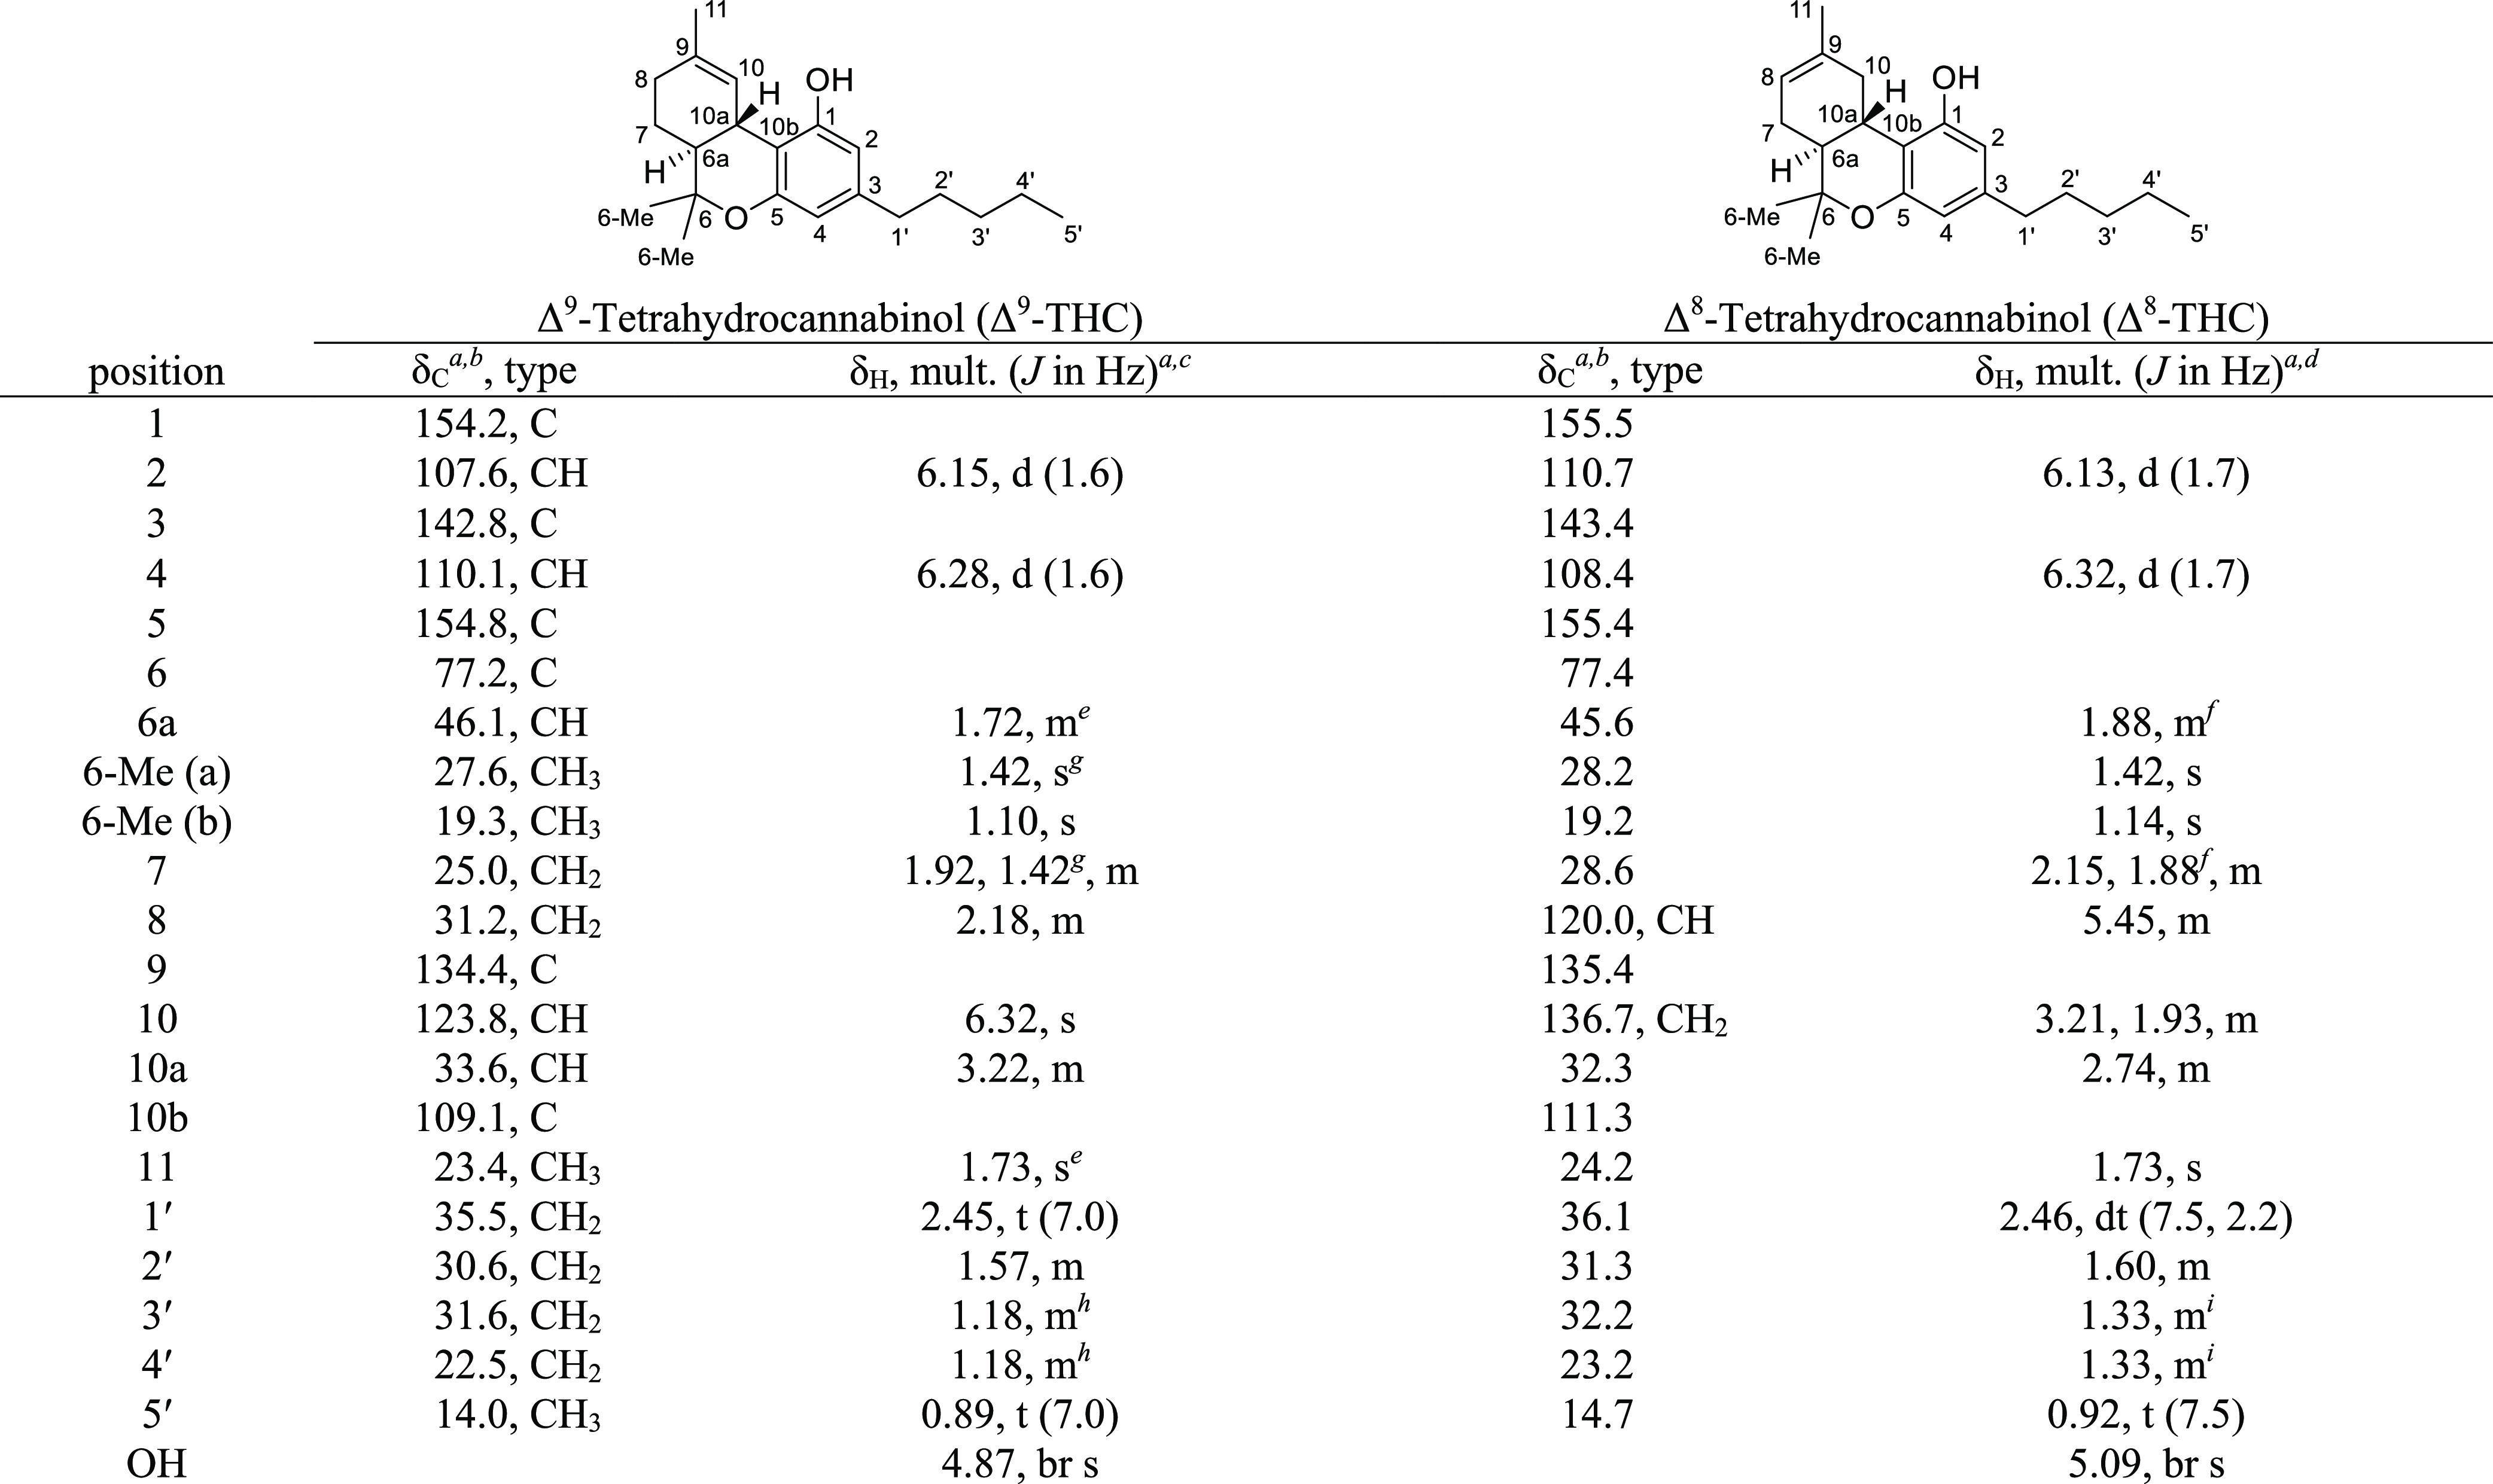
Table 5. NMR Spectroscopy Data (400 MHz, CDCl3) of Δ9-THC and (300 MHz, CDCl3) of Δ8-THC.

Chemical shifts (in ppm) were determined with reference to TMS.
Spectra recorded at 101 MHz.
Spectra recorded at 400 MHz.
Spectra recorded at 300 MHz.
Chemical shifts bearing the same symbol overlap.
